
Throughout the economic shutdown and state- and county-mandated stay-at-home periods, bike sales skyrocketed and VMT — vehicle miles traveled — plummeted. (VMT measures the amount of travel for all vehicles in a geographic region during a certain period.)
This post is part of our “COVID-19 and Cities” series, which features experts’ views on the global pandemic and its impact on our lives.
Online and in local bike shops, inventory was drained as customers bought up bikes in every size and category. The surge in demand came at a time when the supply chain already was disrupted by American tariffs on Chinese goods and the coronavirus’ impact on production in China, where a lot of bikes and cycling accessories like helmets are manufactured.
“Bicycles are the new toilet paper,” Adam Potter, owner of Houston bike shop Planetary Cycles, told the Houston Chronicle. Since the start of the shutdown, Potter reported sales in his shop being up 50% over the same period in 2019.
Analysis from Steetlight Data shows big increases in bicycle miles traveled in May of this year compared to May 2019. Cycling doubled in metros not known for bike commuting, including Ogden and Provo in Utah; Lakeland, Florida; Knoxville, Tennessee; Columbia, South Carolina; and Oxnard, California. Both the number of bike trips and the length of trips increased. Houston, Dallas and San Antonio all saw large (50–89%) increases in bicycling activity.
Some cities with reputations for being bike-friendly — Portland, Oregon; New York; Boston; San Francisco; and the District of Columbia — experienced decreases in cycling. However, bicycling miles decreased less than car miles decreased, according to the mobility analytics firm.
Because of COVID-19, it’s estimated that the average VMT in the U.S. for 2020 will be 1 billion miles less each day than in 2019. Dropping from 9 billion miles a day to 7.9 billion — an 11.4% decrease. The change likely isn’t permanent. In fact, daily VMT is expected to increase to 8.8 billion in 2021.
Reduced VMT resulting from people staying home also translates to lost revenue.
Researchers at the JP Morgan Chase Institute used monthly credit card transactions from “de-identified” Chase customers between October 2019 and March 2020 to study the early impact of the pandemic on local commerce in 16 of the largest U.S. metro areas. In Houston, spending on “fuel,” which includes purchases made at gas stations and stores at gas stations, dropped by 29% in March, 62% in April and 52% in May compared to 2019.
In March, April and May, the U.S. Department of Transportation lost $43.5 million a day in federal gas tax losses, according to Boston Consulting Group’s Trip Reduction Index. Texas lost an estimated $5.5 million a day in gas tax revenue. The revenue lost in gas taxes coupled with the loss of state sales tax revenue because of the COVID-19 crisis are contributing greatly to Texas’s projected $4.6 billion deficit — the biggest it’s ever faced.
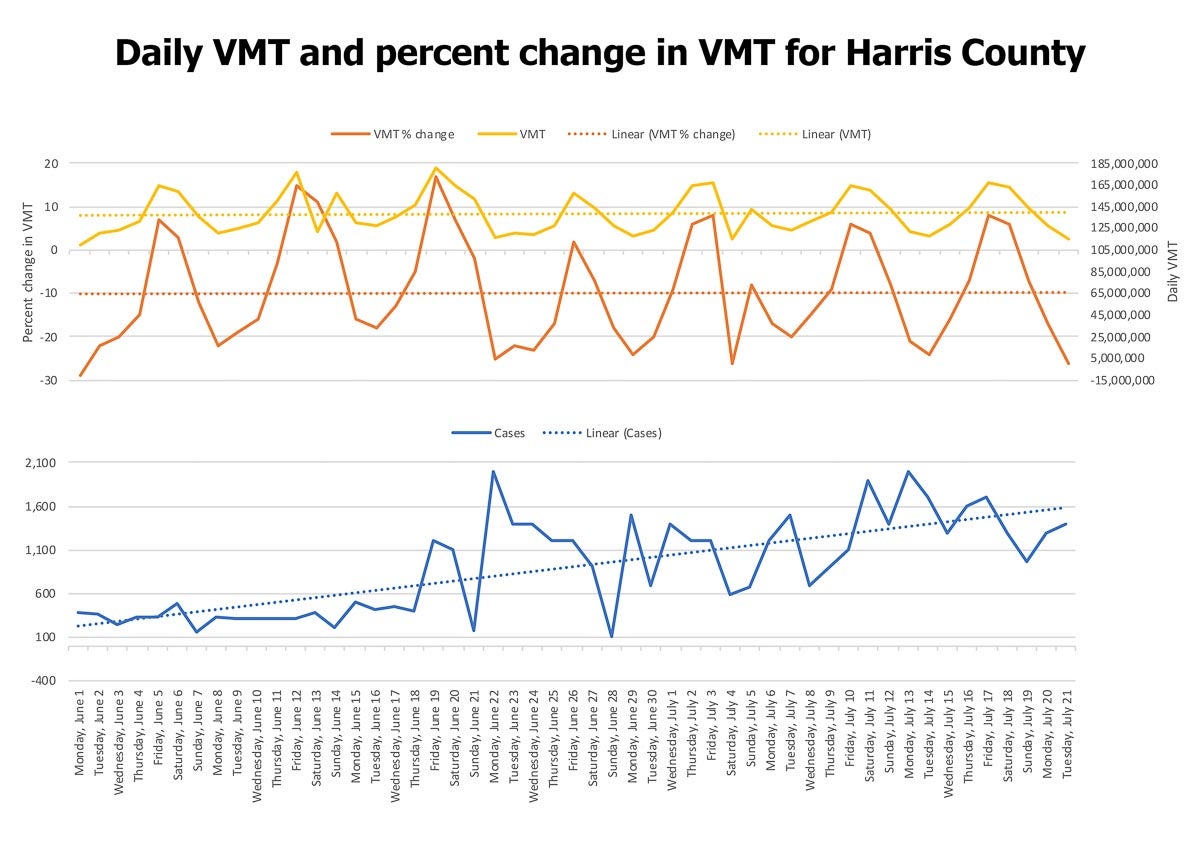
Data sources: Streetlight Data VMT Monitor and Harris County Public Health
Significant reductions in traffic and a drop in emissions
Between March 15 and June 15, greenhouse gas emissions in the U.S. fell 18% below last year’s level during that same period, according to research firm Rhodium Group. Global emissions have dropped by 4.6%, according to University of Sydney researchers. Worldwide carbon emissions for 2020 are projected to be 7% less than in 2019.
Before COVID-19, Texas led the nation in carbon emissions. The state produced 711 million metric tons from power plants and 232 million metric tons from transportation in 2017. Since 1990, transportation-related CO2 emissions have increased by 52%. In that same time, emissions from power plants have gone up by 17%.
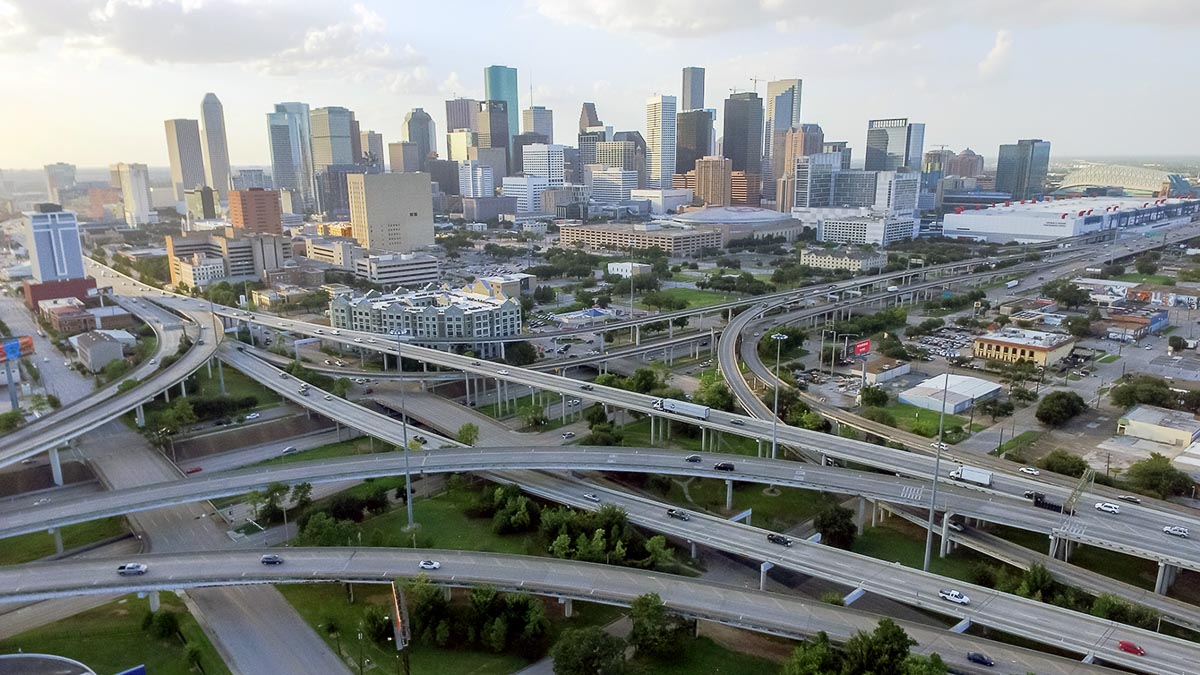
While the pandemic hasn’t moved the needle on ozone levels in Houston, the city and all of Harris County saw a dramatic drop in traffic levels lasting from mid-March till early June. A VMT Monitor developed by Streetlight Data provides daily totals of vehicle miles traveled in each county in the U.S., as well as the percent change in VMT between a given date and a baseline VMT, which is defined as the average daily VMT in each county for January 2020. For Harris County, that baseline is 154,205,000 miles. The total vehicle miles traveled in the county dropped to the lowest level — 51,900,000 miles — on March 21, a 66% reduction.
As the state’s stay-at-home order was allowed to lapse on April 30 and reopening of businesses in Texas began, the daily VMT increased, especially in the suburban counties surrounding Houston. Compared to January, the daily change in VMT in suburban counties consistently was 15–20 percentage points higher than in Harris County.
Researchers at the Johns Hopkins Bloomberg School of Public Health analyzed more than 900 metropolitan counties and found no direct relationship between density and COVID-19 infection and mortality rates. Instead, they conclude, connectivity — rather than density — of cities in a metropolitan area such as Houston’s is central to the spread of COVID-19.
“Counties in metropolitan areas share transportation and commuting patterns, or ‘movement of people,’ between counties and within the metropolitan areas, which is an ideal situation for the spread of pandemics. … The pandemic spread is facilitated more by the connectivity of a major urban hub to the surrounding geographic units than by the density of the hub. The megacities and megaregions (either compact or sprawling) that are superconnected are the incubators of pandemic outbreaks.”
The rise in VMT followed by a rise in infections
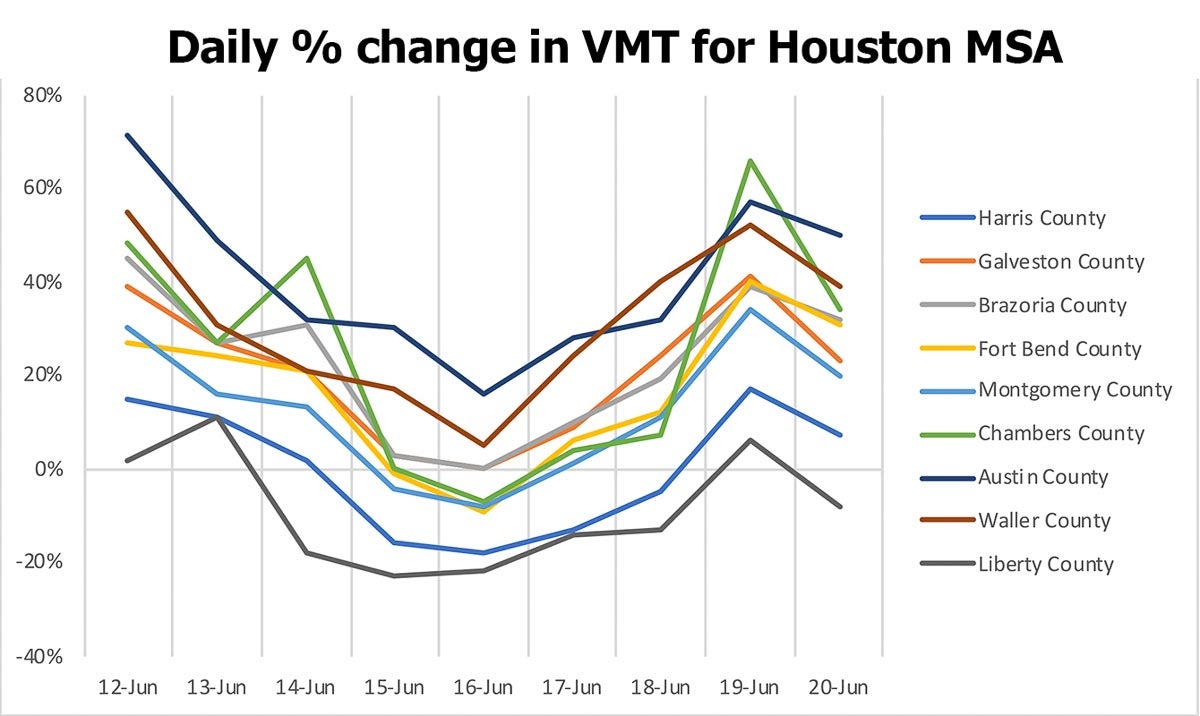
On June 3, the third phase of Gov. Greg Abbott’s reopening plan began, allowing bars to open at 50% and restaurants to increase the number of people at a table from six to 10. Friday, June 5, was the first day the daily total VMT in Harris County moved out of negative territory since the middle of March. That day, VMT increased 7% in Harris County, but the increase was much higher in surrounding counties — Galveston County: 27%, Brazoria County: 39%, Fort Bend County: 24%, Montgomery County: 18%, Chambers County: 39%, Austin County: 49% and Waller County: 40%. There was a 6% decrease in Liberty County.
Two weeks later, on June 19, confirmed cases of COVID-19 in Harris County surged to 1,200 — a 300% increase from the day before. According to the CDC, symptoms of COVID-19 appear two to 14 days after exposure to the coronavirus.
Restaurants and retail stores were allowed to expand operations to 75% capacity on June 12. The total VMT in Harris County that day was 177 million miles (15%), the highest total since 173 million miles on March 13, the day Gov. Abbott issued a disaster proclamation for the state and HISD closed schools.
VMTs increased surrounding counties as well — Galveston County: 39%, Brazoria County: 45%, Fort Bend County: 27%, Montgomery County: 30%, Chambers County: 48%, Austin County: 71%, Waller County: 55% and Liberty County: 2%.
A week later, on June 19, VMT peaked at 181 million in Harris County, a 17% increase over January. On June 26, bars in Texas were ordered to close again.
On July 3, Gov. Abbott asked people to again stay home.
Below are some other significant dates during the pandemic and the VMT data for those days in Harris County:
March 5: 197,000,000 VMT (28% increase)
The first cases of COVID-19 are confirmed in Harris County.
March 11: 185,000,000 VMT (20% increase)
The World Health Organization characterizes COVID-19 as a pandemic.
March 17: 134,000,000 VMT (-13%)
In Harris County, restaurants are restricted to take-out and delivery only and bars are closed.
March 20: 88,600,000 VMT (-43%)
Restaurant dining rooms, bars, gym and schools are closed statewide.
March 21: 51,900,000 VMT (-66%)
The largest decline in daily VMT in Harris County
March 24: 113,000,000 VMT (-27%)
Harris County’s stay-at-home order goes into effect.
April 1: 93,000,000 VMT (-39%)
Statewide stay-at-home order goes into effect.