

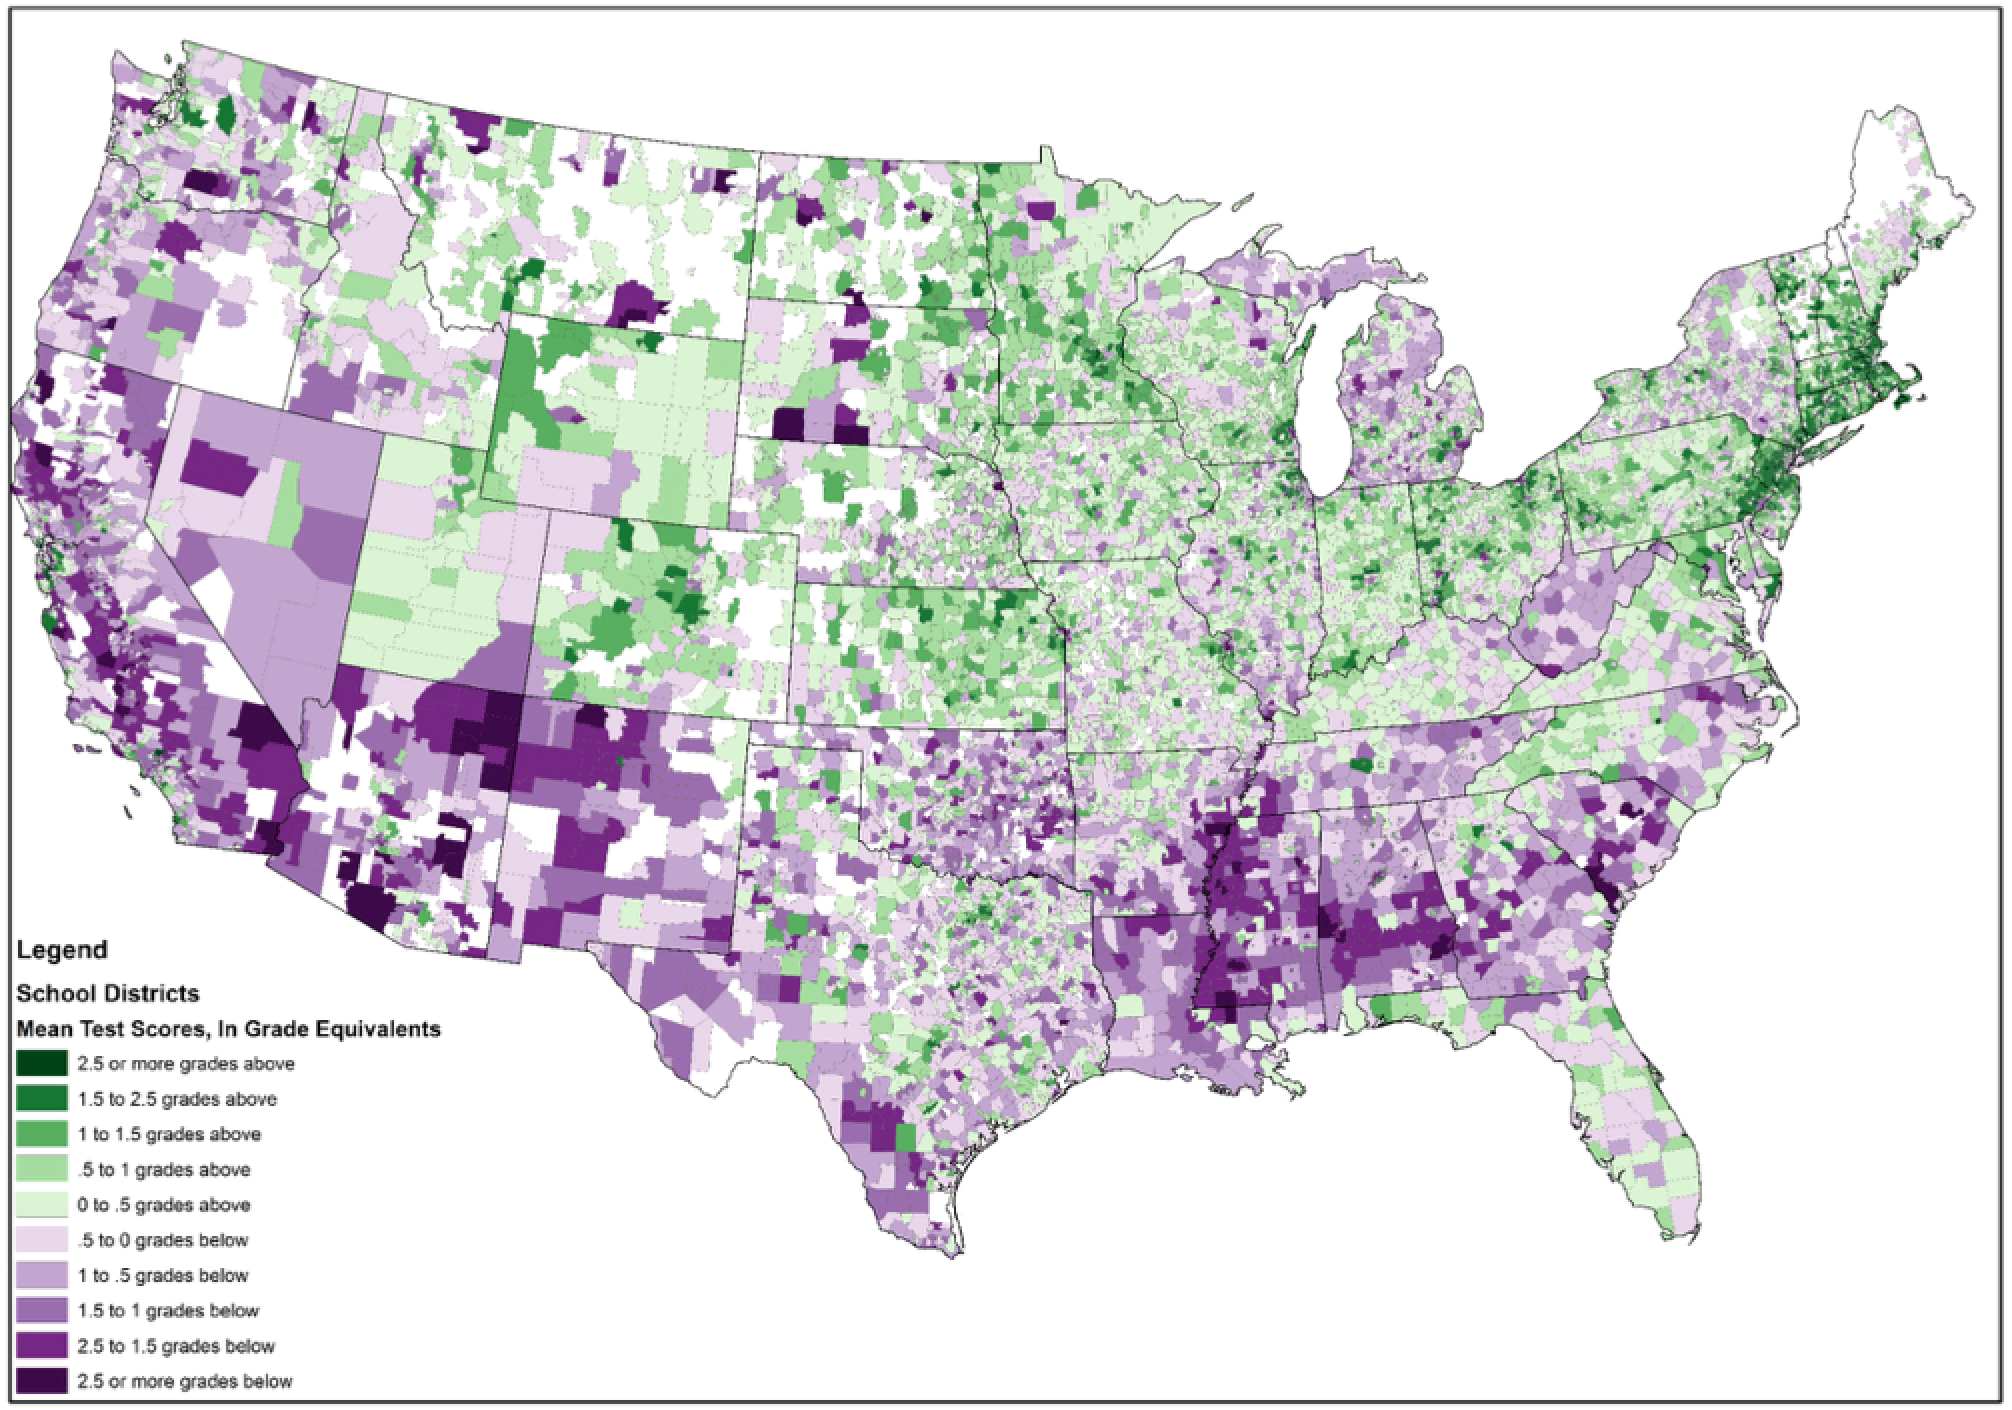
Three hundred million test scores won't tell you everything about American students. They won't necessarily tell you the quality of their schools. They won't even tell you that much about the individual student. But scattered across the country's more than 12,000 school districts, they will reveal telling patterns about inequality.
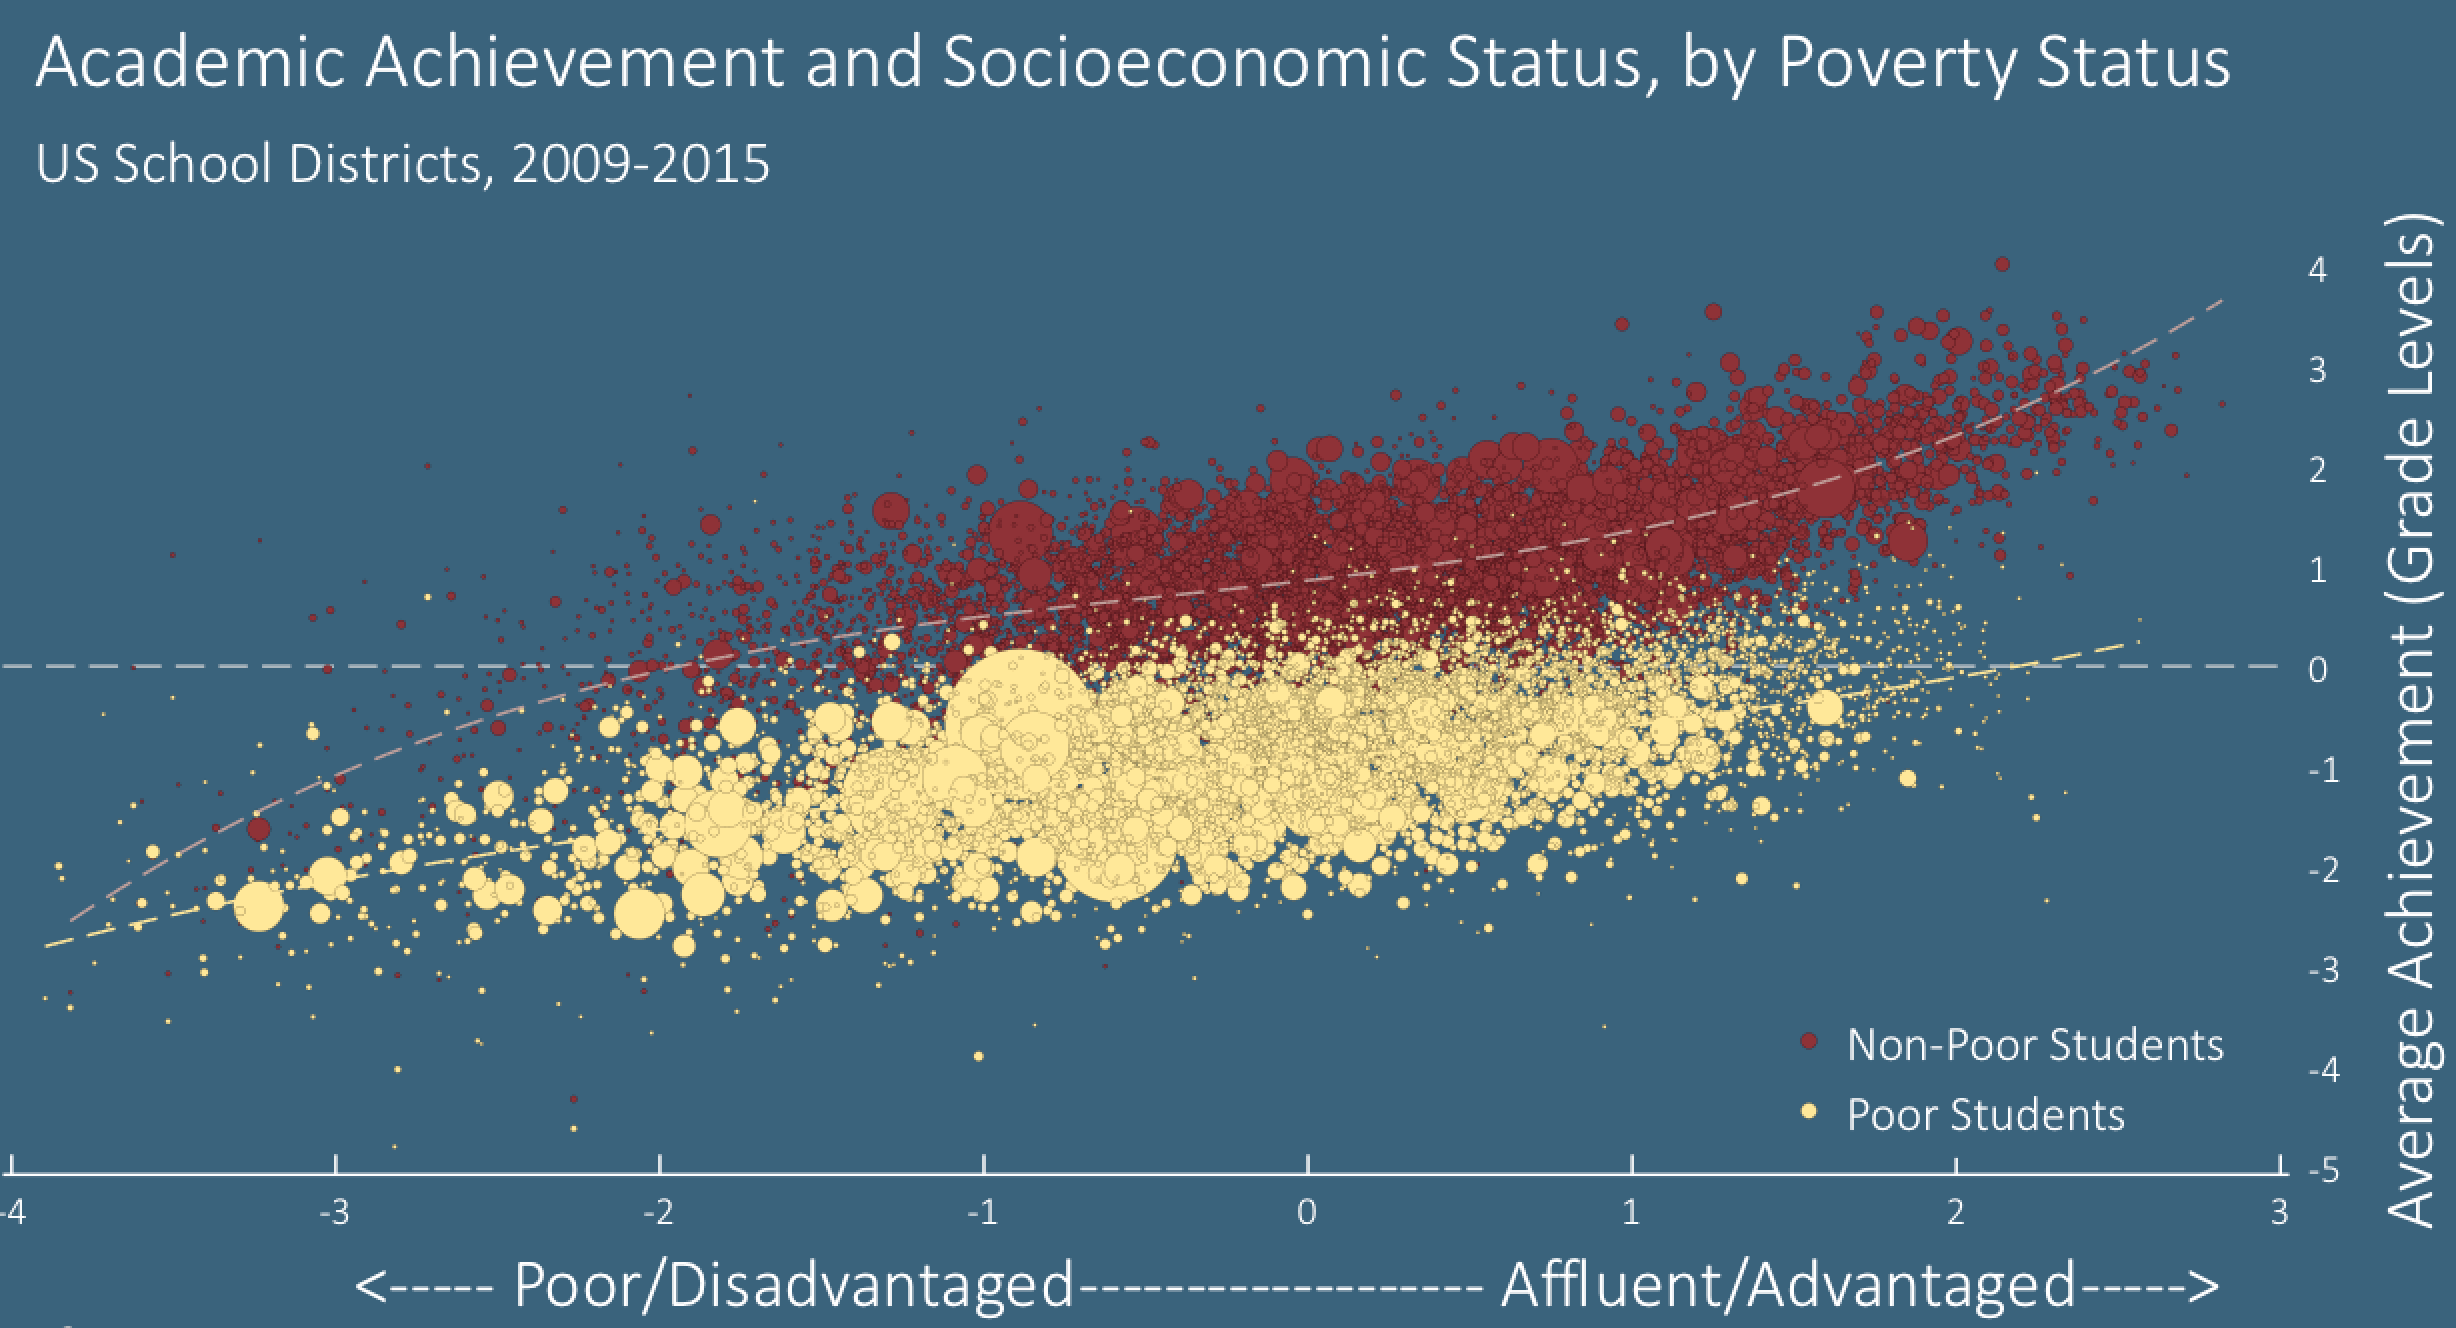
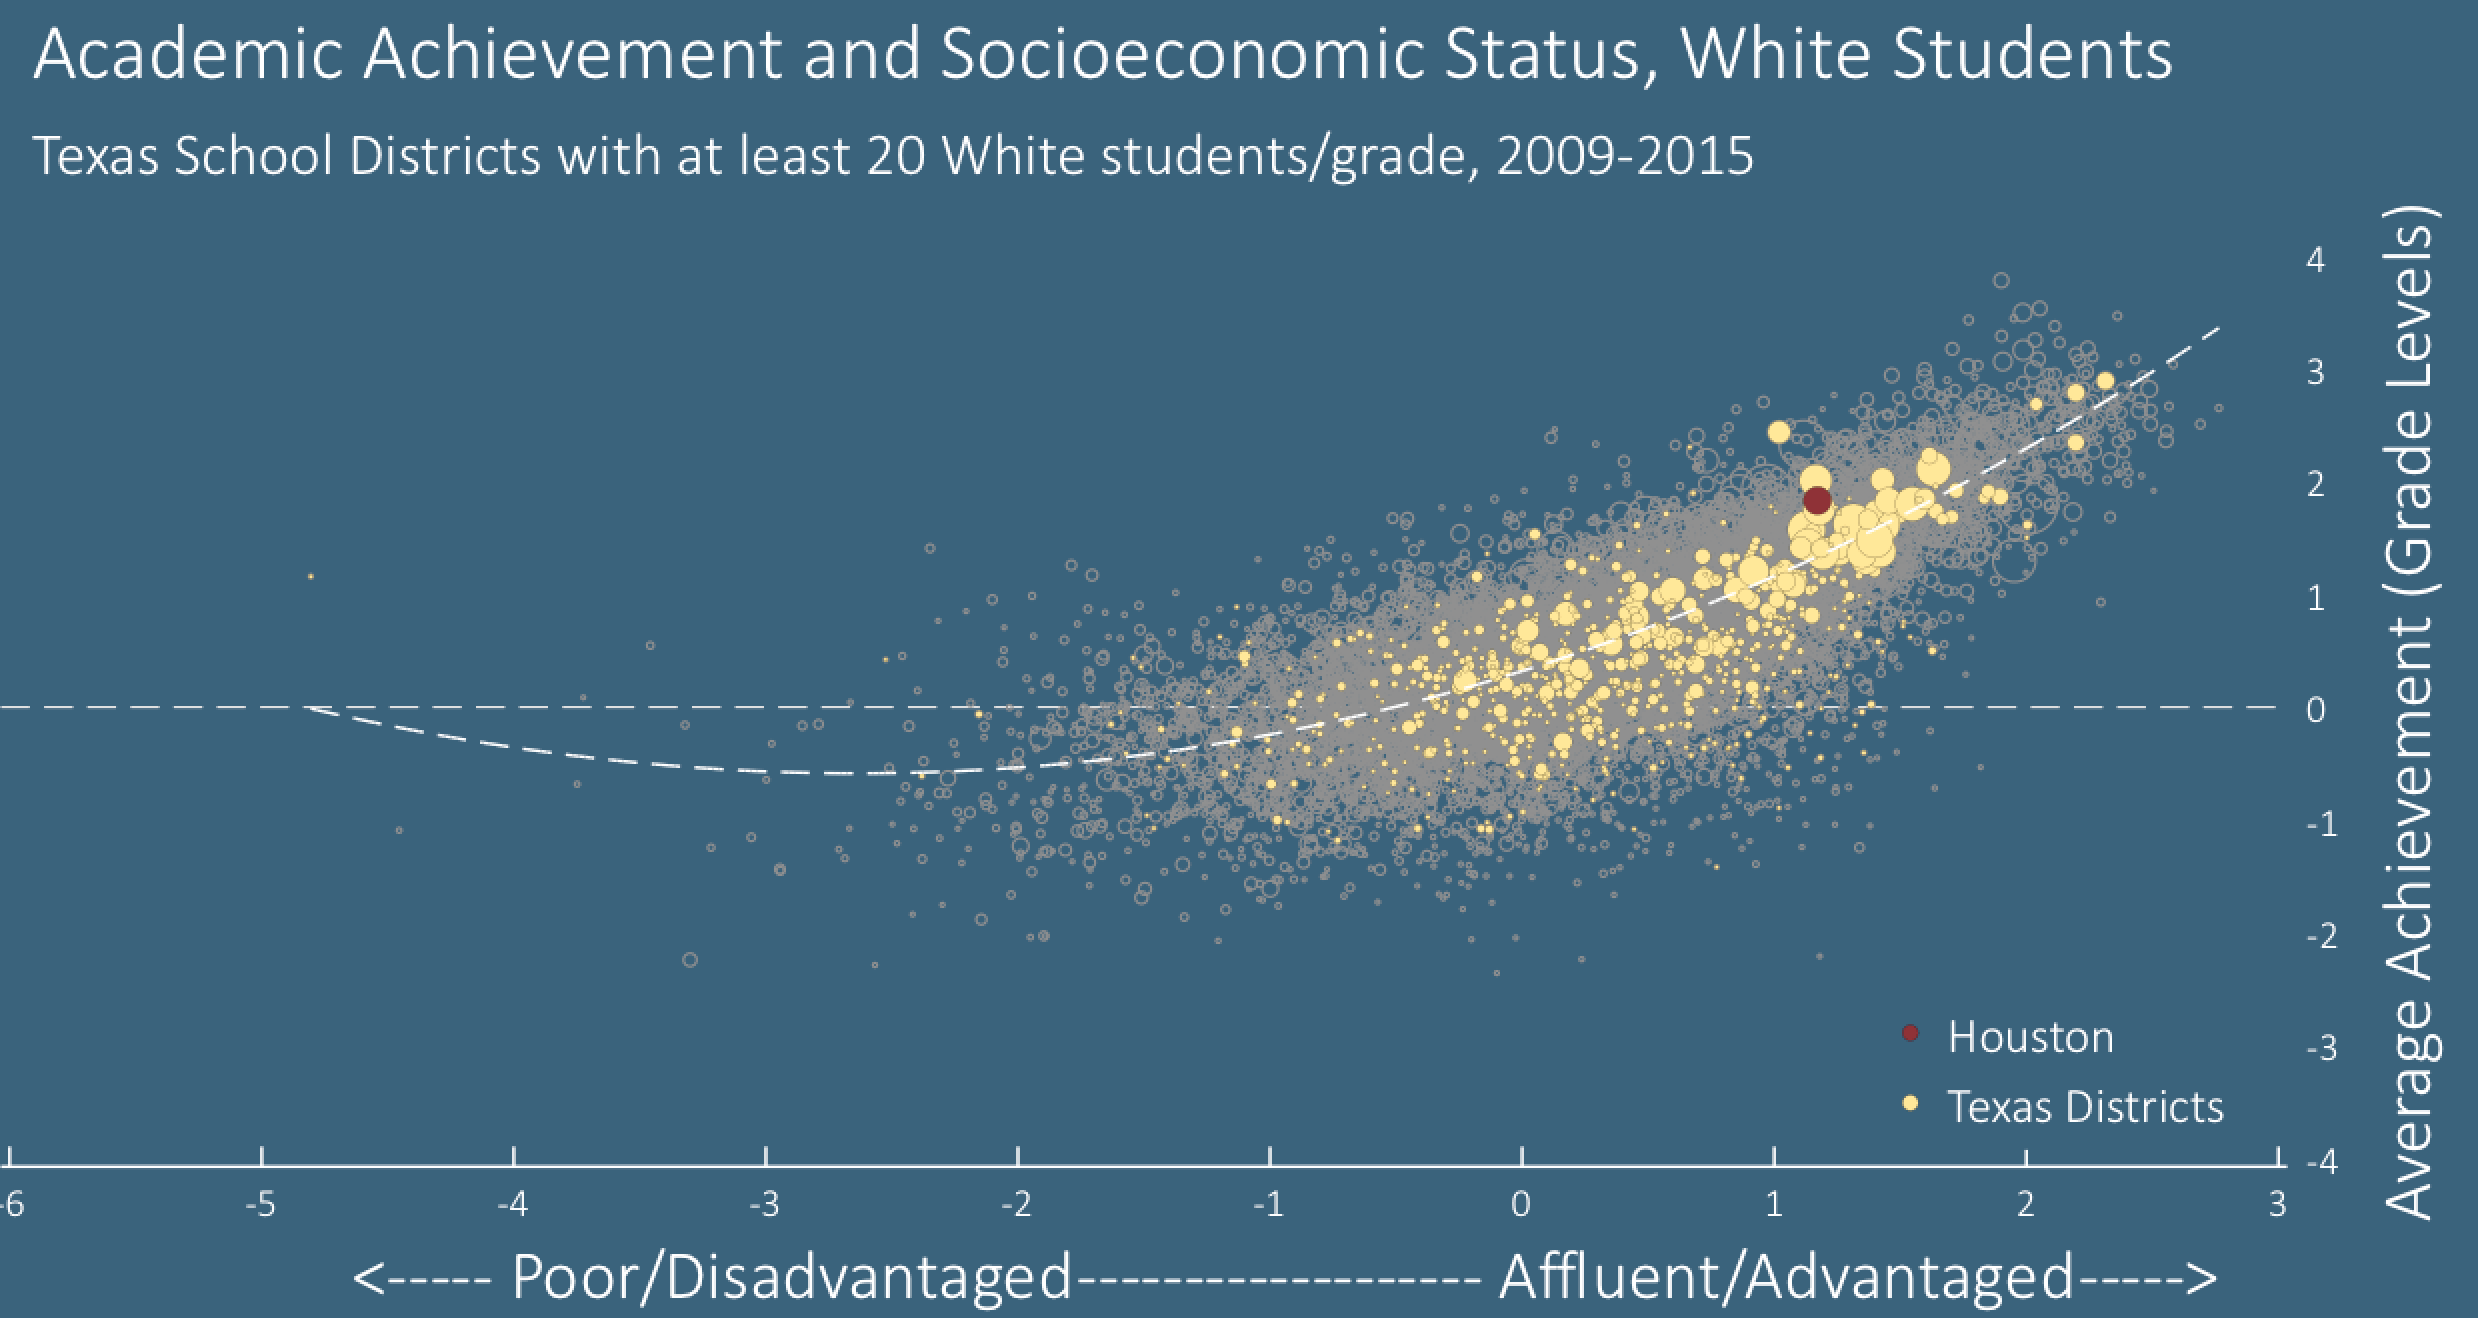
"Almost everywhere the average non-poor student scores above the national average, well above in many cases," said Sean Reardon, professor of poverty and inequality in education at Stanford University, Wednesday evening during his Kinder Institute Forum presentation reviewing the findings of his analysis of some 300 million test scores. "For poor students, it's dramatically lower. That difference is about two grade levels."
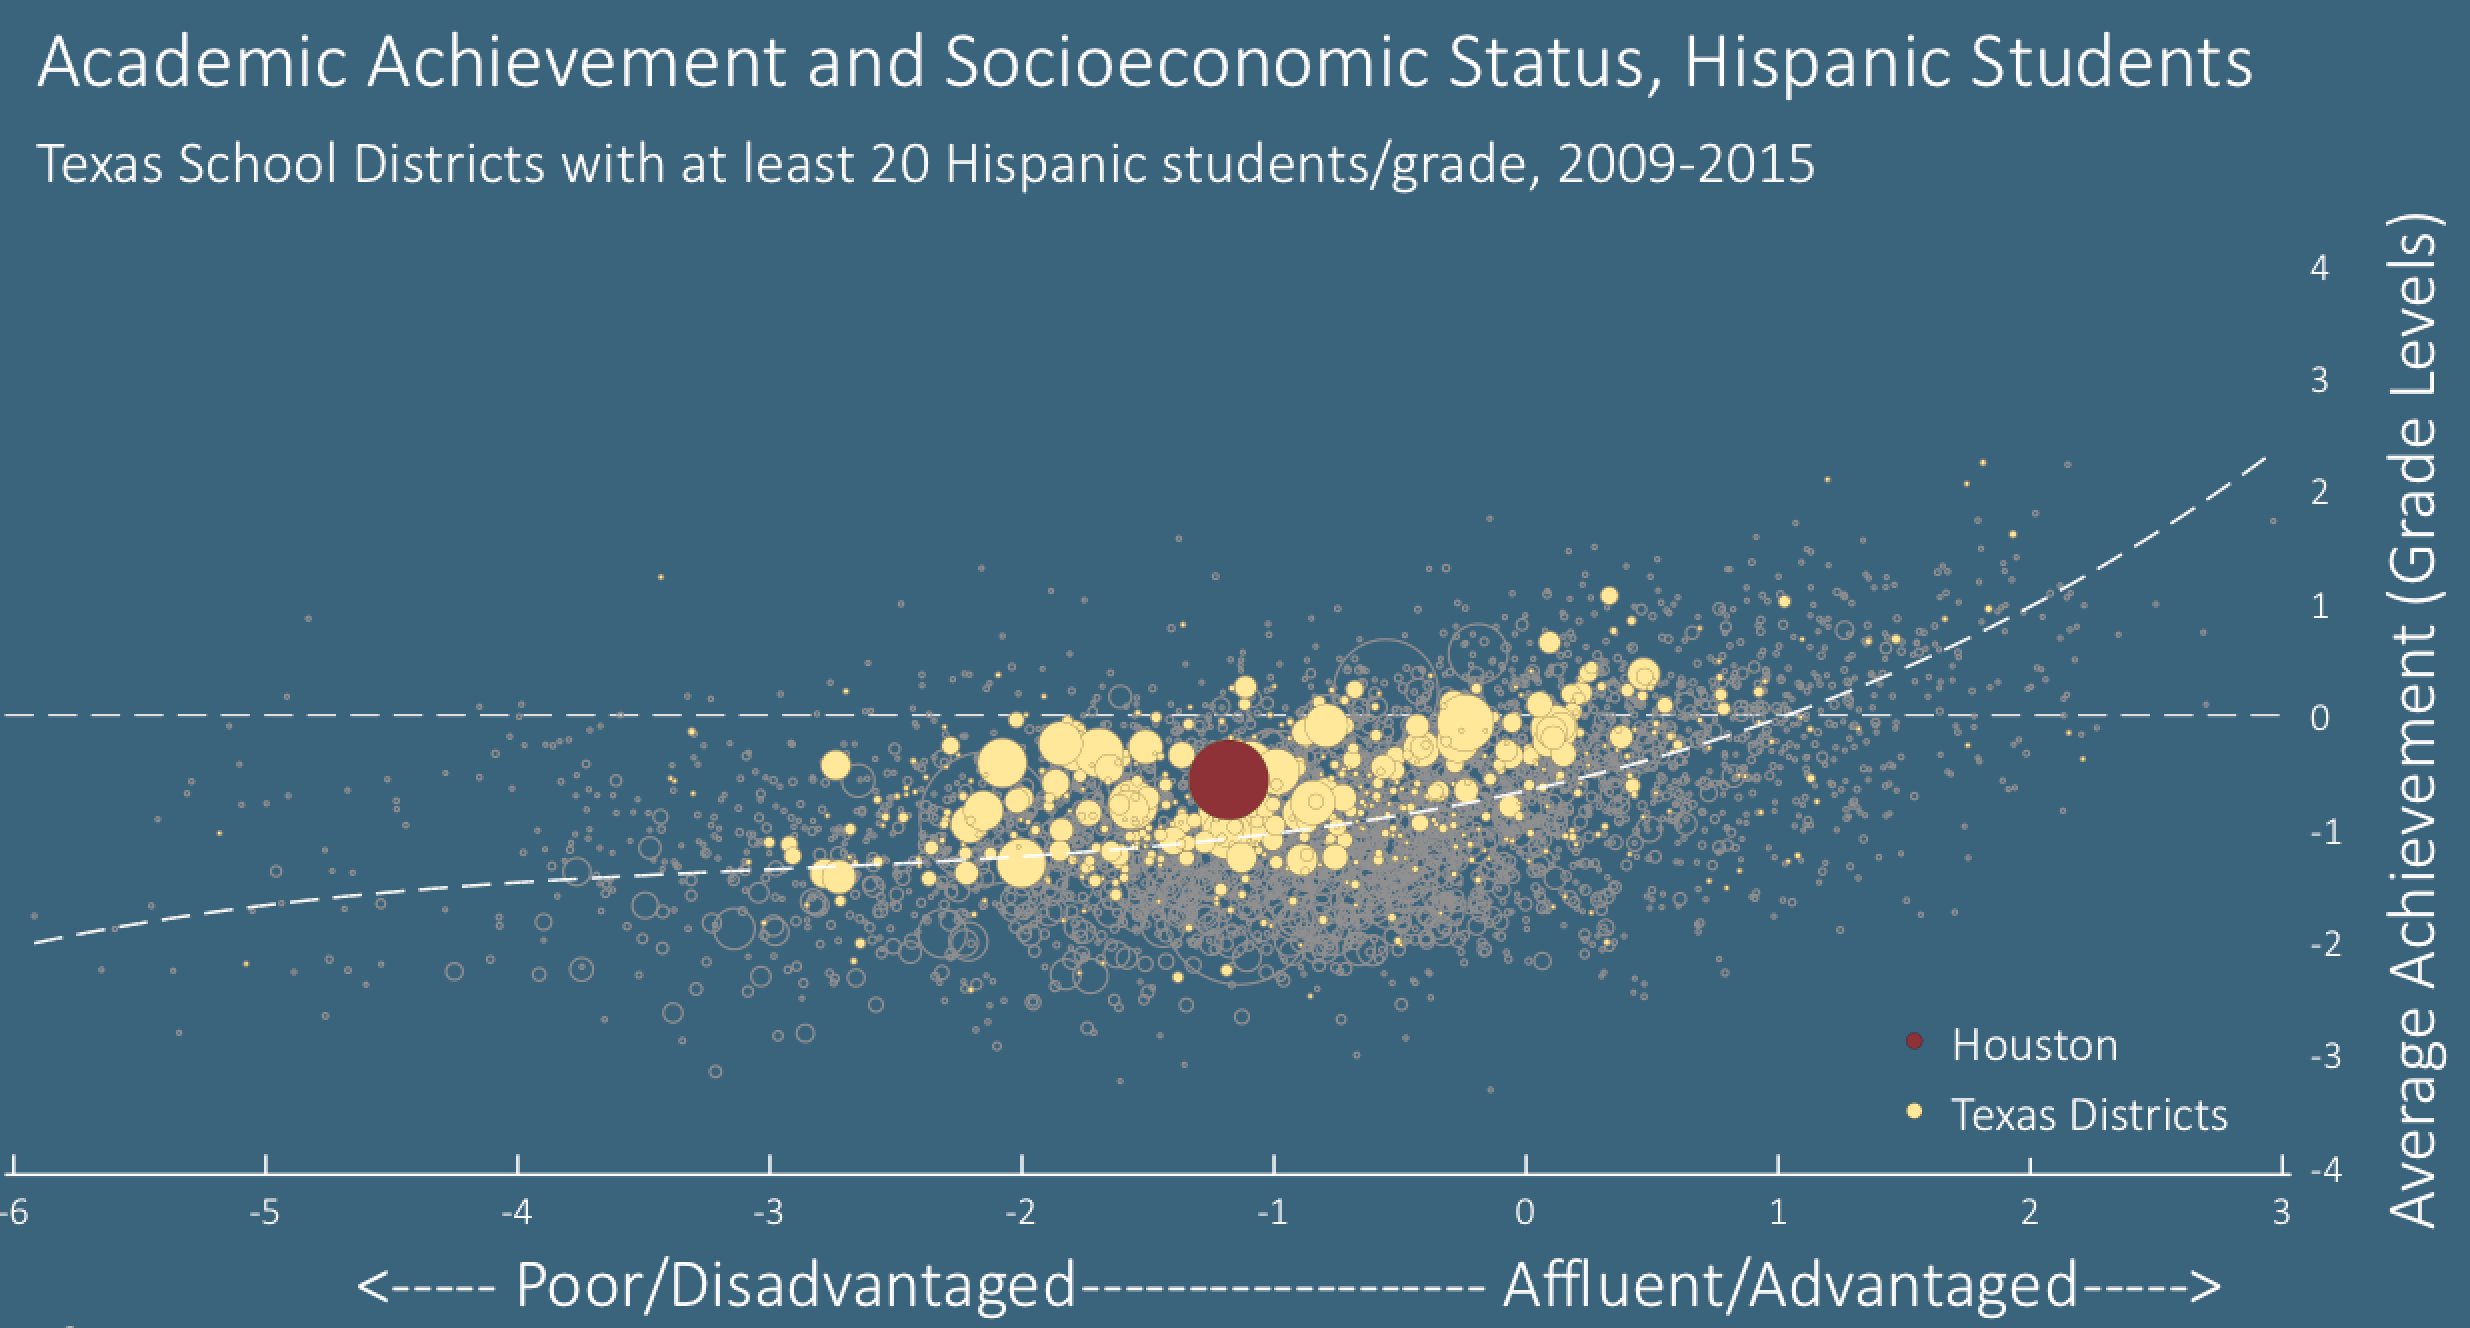
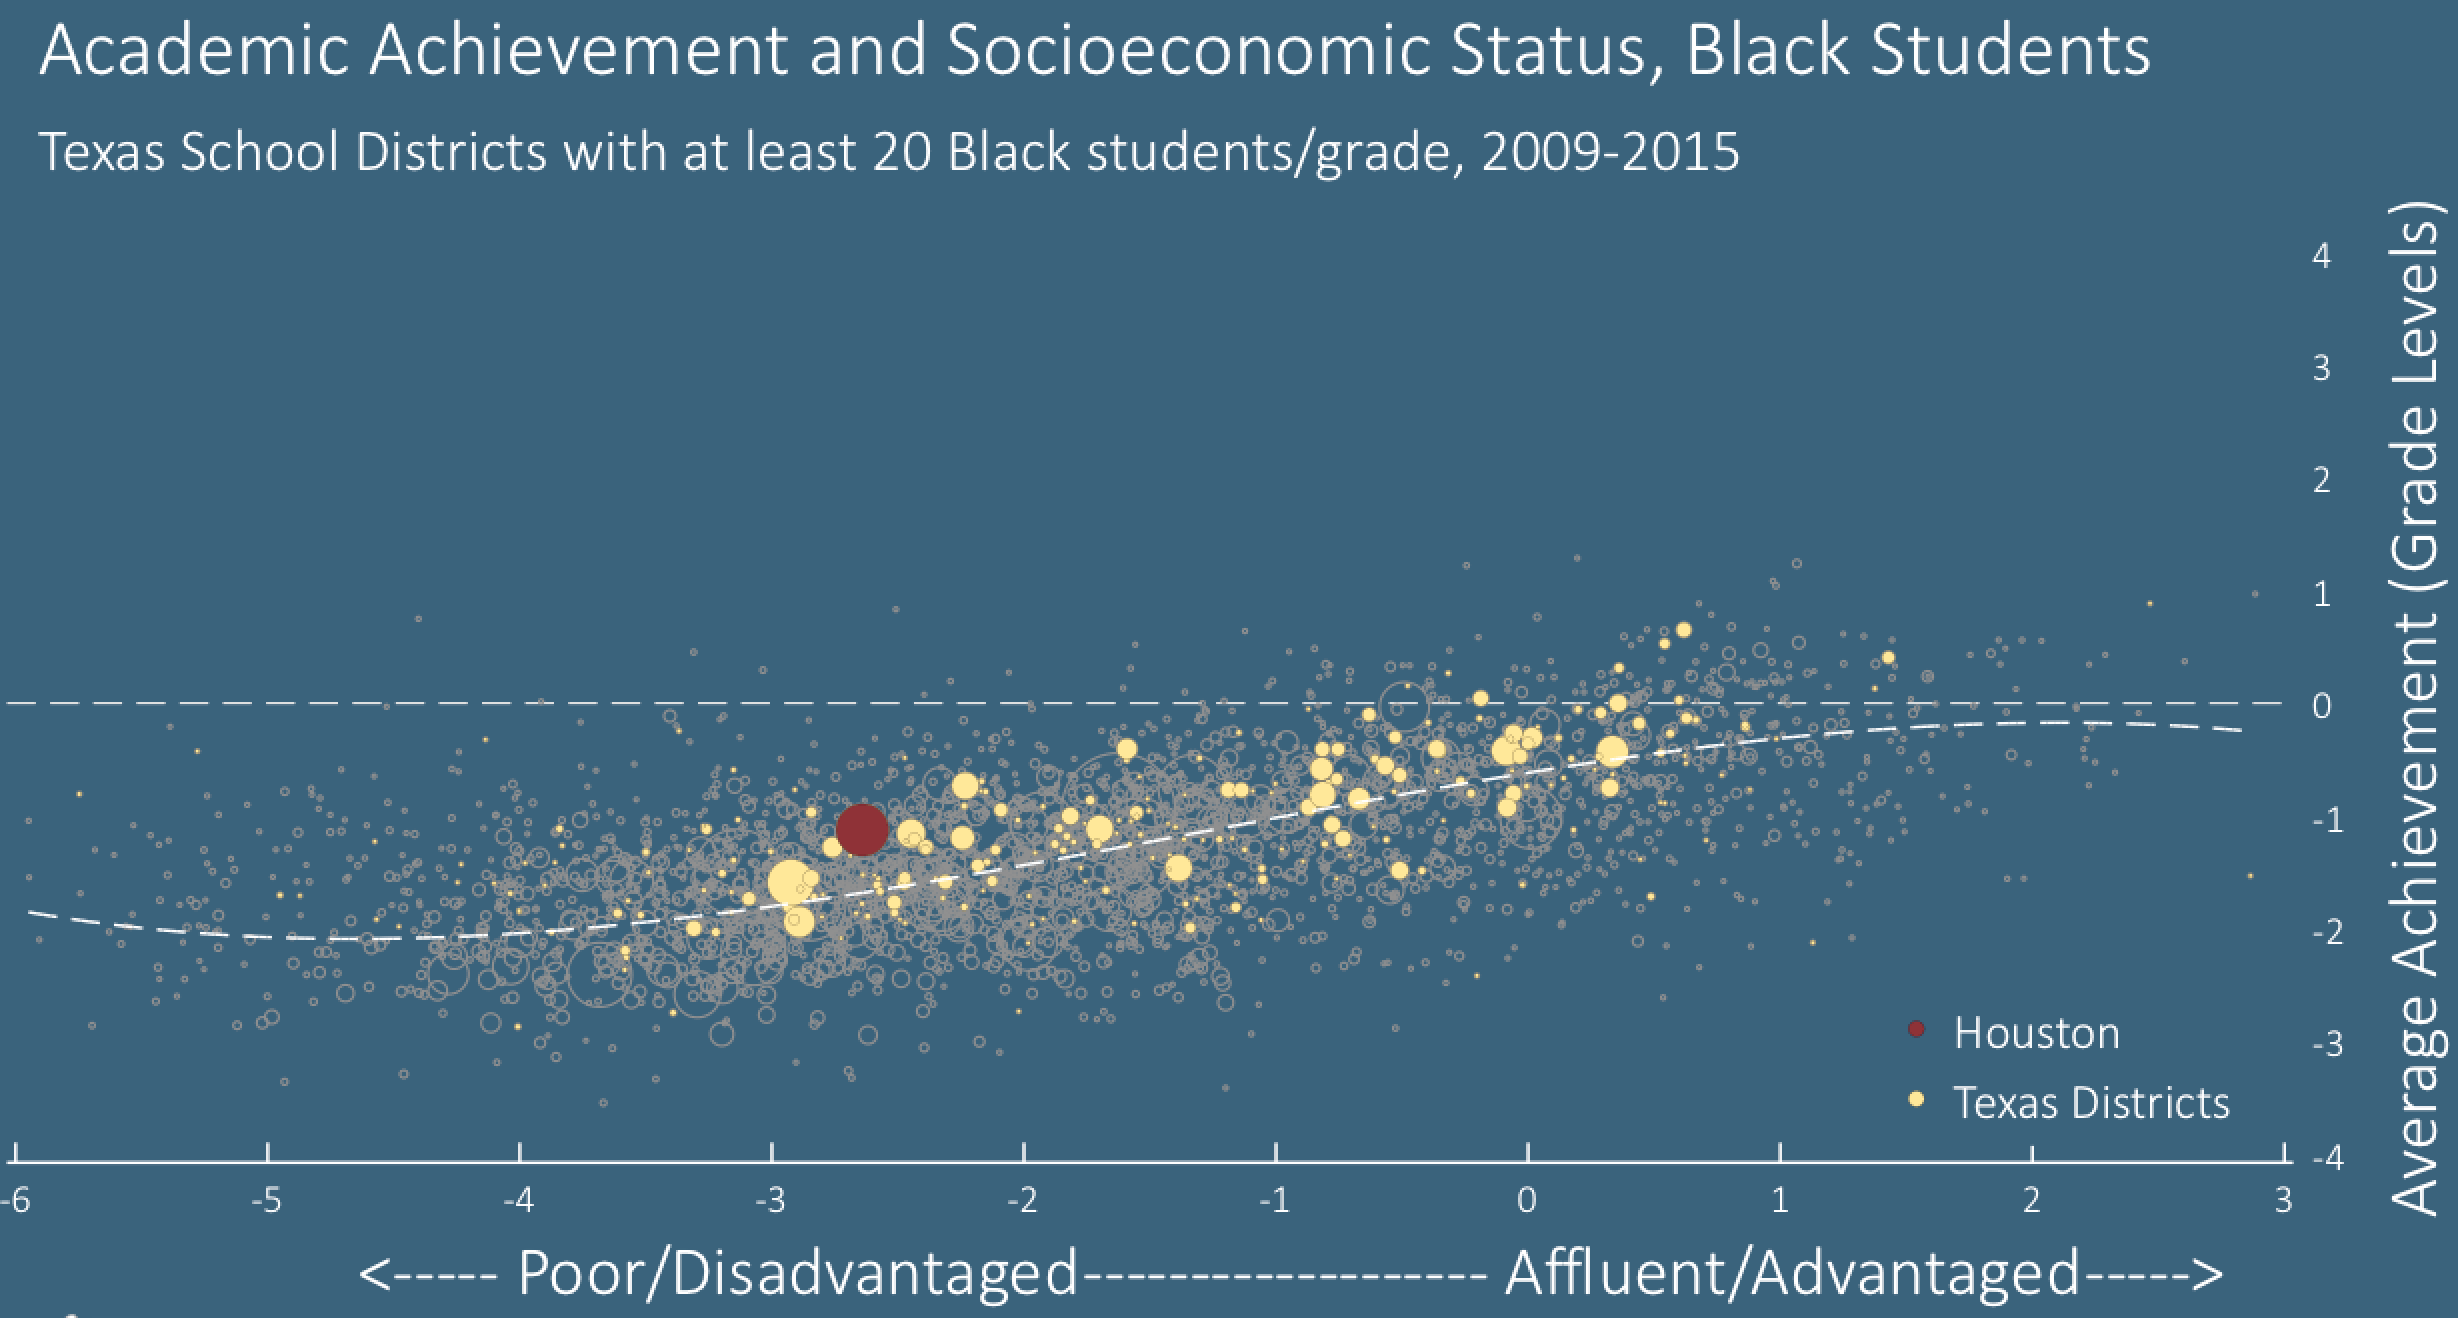
Looking at standardized testing data over several years, Reardon found similarly constant gaps between white and black students, as well as white and Hispanic students. That held true even when socioeconomic gaps between the groups had closed. The only school district that did not have a gap in test scores between its white and black students, said Reardon, was in Detroit, where white and black students were both poor and low-performing on tests.
To Reardon, these patterns suggest that it isn't simply that the quality of schools is unequal or even that students from low-income families tend to have fewer resources to set them up for academic success. Instead, he said, it reflects something discriminatory in how opportunity itself is structured in this country.
"The single best correlate," said Reardon, "if you just had to pick one thing, of the racial achievement gap is not the differences in family backgrounds, it’s the segregation level."
That's not to say socioeconomic status didn't play a role as well. Because wealth is so tied to race in the country, noted Reardon, segregation usually involves both class and race and means that black students are much more likely to attend socioeconomically disadvantaged schools than white students, for example. "Segregation is deeply implicated in the patterns of inequality of opportunity," said Reardon.
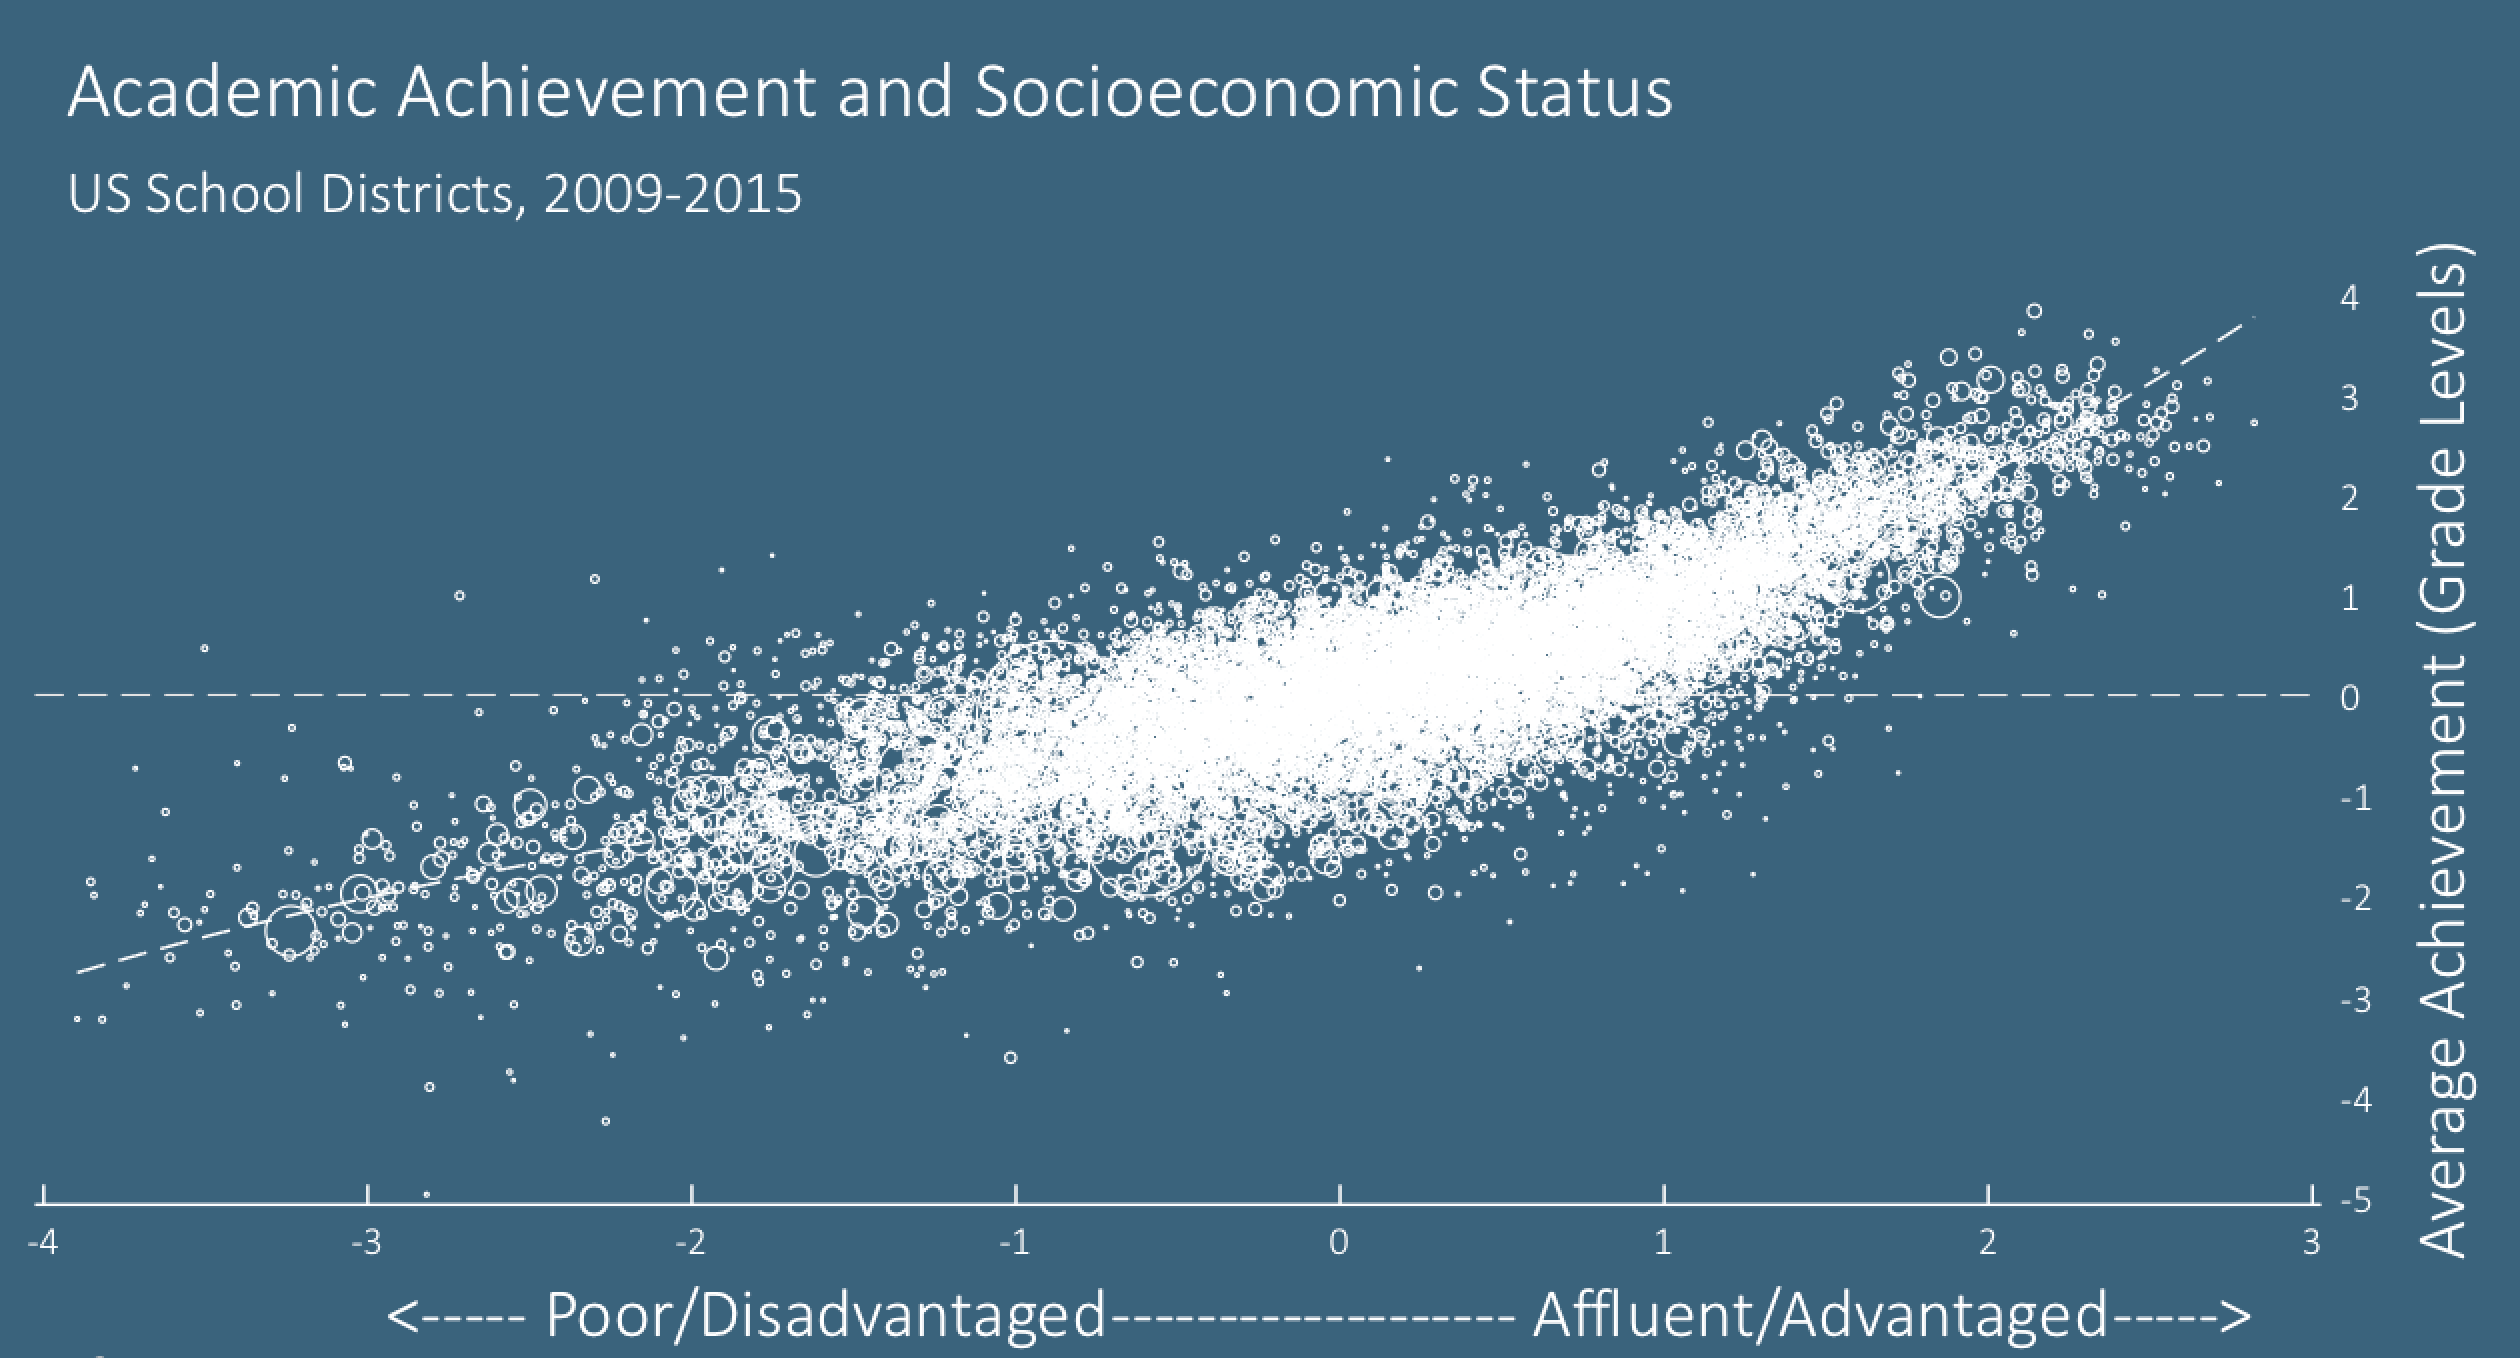
Like an inkblot of social ills, the stark contrasts and persistent gaps between students based on race and socioeconomic status are clear enough in a chart but their meaning is up for debate, and has been for decades.
When the education field marked the 50th anniversary of the landmark Coleman Report in 2016, the concerns of that study, conducted in the wake of desegregation rulings to assess the country's progress, were still concerning.
Led by sociologist James Coleman, the team of researchers behind the report sought to document how segregated the schools still were and the corresponding variation in quality of schools. The report also set out to "discern possible relationships between students' achievement, on the one hand, and the kinds of schools they attend on the other," and to assess whether educational inequality was more about inequality in schools or inequality in the homes and neighborhoods the students came from.
More than half a century later those questions are still animating much of education research.
"This is sort of a central question because, if the reason that low-income school districts have low test scores and low opportunities is because they have less high quality school systems, then we ought to really invest in fixing those school systems," said Reardon. "But if it's because of things beyond the school’s control," including socioeconomic segregation, "then maybe the place we should invest isn’t primarily in the school system or only in the school system, but we ought to think about investing as much in opportunities outside the school system."
Indeed, Reardon said, the data shows that students are coming to school already bearing the marks of socioeconomic inequality. And those gaps often worsen over time.
"It'd be a lot easier for the schools to do their work if we figured out how to get kids on an even playing field by the time they got in the door," he said.
"We see this very consistent pattern," explained Reardon, "economic disparities between communities or between groups within communities is enormously predictive," as is the relative segregation between groups. "Any strategy we have that’s going to have a hope of reducing [performance gaps], has to have those as part of its target," said Reardon. "Anything else runs the risk of fiddling around the edges while there’s this enormous structural inequality in place."