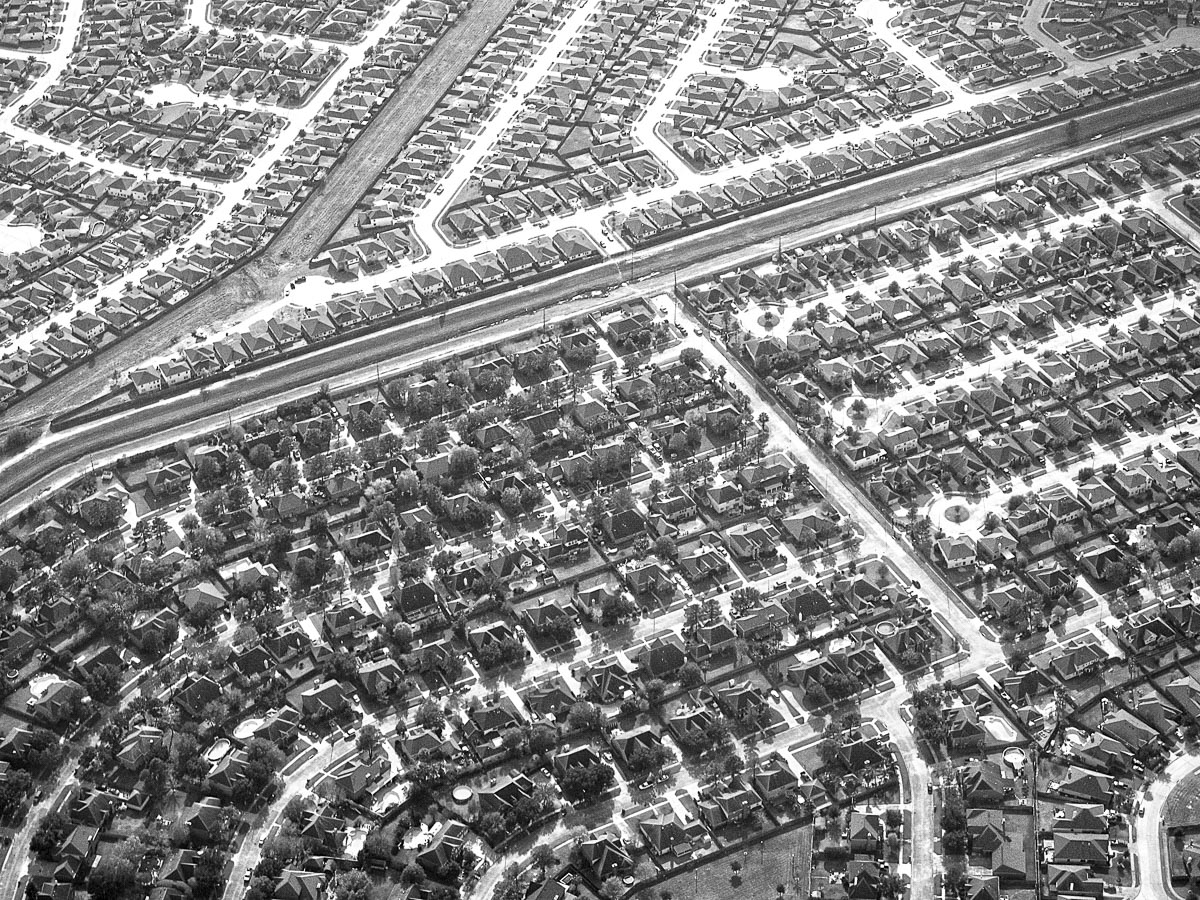
At least that’s the conclusion of one of the nation’s most astute urban growth economists, Jed Kolko, chief economist at Indeed.com and recently tapped to serve as the Undersecretary of Commerce for Economic Affairs.
In a recent article for The New York Times Upshot section, Kolko declared the 2010s as “the downtown decade,” because overall urban densities went up between 2010 and 2020, according to the Census. Kolko made his data available at both the metropolitan and the Census tract level. His calculations found that Houston, Dallas-Fort Worth, and Austin all increased their metropolitan density during the last 10 years. San Antonio held even. Just about all the other Texas metros increased their metropolitan sprawl.
To understand Kolko’s analysis, you have to understand how Kolko analyzed tract-level data to find the net density or net sprawl. (Warning: This gets pretty nerdy.)
He used what the Census Bureau calls “weighted population density” – or, in his description, the weighted average of Census tract population density (tract population divided by tract land area) for all tracts in the metropolitan area, where the weight is the tract’s share of metropolitan population. In essence, this weighting eliminates the problem created by tracts with no population – or, as Kolko calls it, “the San Bernardino County problem.”
San Bernardino County includes more than 20,000s square miles – more than Massachusetts and New Jersey combined. But much of that land is national forest with nobody living in the Census tracts. In most developed areas of San Bernardino County, people live at typical suburban densities. By giving zero-population tracts a weight of zero in his analysis, Kolko’s analysis can factor in only the areas that are developed.
And by that measure, Austin is densifying fast. Yes, the outer counties are growing like mad, but so is Downtown Austin. When you net all this out, metropolitan Austin increased its density by 23%– going up from 1,291 residents per square mile in 2010 to 1,593 residents per square mile in 2020.
Even so, Austin isn’t the densest metropolitan area in Texas. That honor belongs to the nine-county Houston region, which increased from 1,560 residents per square mile in 2010 to 1,858 in 2020, an increase of about 19%. DFW’s numbers are almost identical to Houston’s. (It’s amazing how often Houston and DFW growth numbers are almost identical.)
A few other Texas metros increased their density, including College Station-Bryan, McAllen, and Brownsville. Most other metros slightly increased or slightly decreased their densities. Midland and Odessa, the twin capitals of the oil patch, were the king and queen of sprawl in the 2010s, decreasing their density by about 10% each.
Even as they increased their density, the Texas metros are far behind the national density leaders – New York, Honolulu, San Francisco, Chicago, and Los Angeles. San Francisco’s metropolitan density is about triple of Houston and Dallas, while L.A. is double. (New York is off the charts.)
An interesting further analysis would break down the densities at the county level. It would be interesting to know, for example, how density went up in Harris County as opposed to Fort Bend. But that would have to be a subject for another post.

