

The Kinder Institute analyzed Postal Service change-of-address data—records of when and from where people moved—going back to 2019 for all ZIP codes within Houston city limits. It’s one of the best tools we have for mapping migration patterns between communities.
Houston’s net move-outs increased 41% year-over-year in 2020, to more than 30,000. That net move-out number reflects the number of all move-outs (about 312,000) minus the number of move-ins (about 282,000). Another way to look at it: There were about 13 net move-outs for every 1,000 Houston residents in 2020. (We’ll touch on this later, but a “move” could mean one or more people, depending on the household.)
Data from the first five months of 2021 suggests the trend has continued, with almost 11% more net move-outs compared to the same period in 2020, which included a surge in move-outs that began with the pandemic lockdowns in March and never stopped.
The five Houston ZIP codes experiencing the sharpest year-over-year increase in move-outs per 1,000 residents from March to December 2020 were 77003 (East Downtown), 77027 (River Oaks), 77056 (Uptown), 77063 (Mid-West/Memorial Villages) and 77058 (Clear Lake).
All but one of these ZIP codes have median home prices well above the Houston median of $195,800, according to 2019 American Community Survey data. (Clear Lake-area ZIP code 77058 has a median of $184,500.) Renting is also more expensive in these ZIP codes: All five have higher median gross rents than Houston’s $1,095. That suggests housing played a role, but more analysis is needed.
Some Houston ZIP codes bucked the trend, however, and had fewer net move-outs compared to 2019, including: 77029 (Pleasantville), 77062 (Clear Lake), 77070 (Lakewood Forest/Cypress area), 77024 (Memorial Villages) and 77059 (Clear Lake). Interestingly, some of these were adjacent to areas with high net-move-outs.
Each ZIP code has a different story, but there seems to be evidence of a flight from higher-cost areas and a flight toward further-out suburbs. Work by the personal finance company Bankrate, which also analyzed USPS data, suggests a big motivator behind 2020’s great migration was housing. Bankrate says, in the case of Houston, one of the leading destinations was Katy, which has higher median home prices than Houston but has homes that offer more space, giving homeowners a better deal on a price-per-square-foot basis at a time when more workers were setting up offices at home.
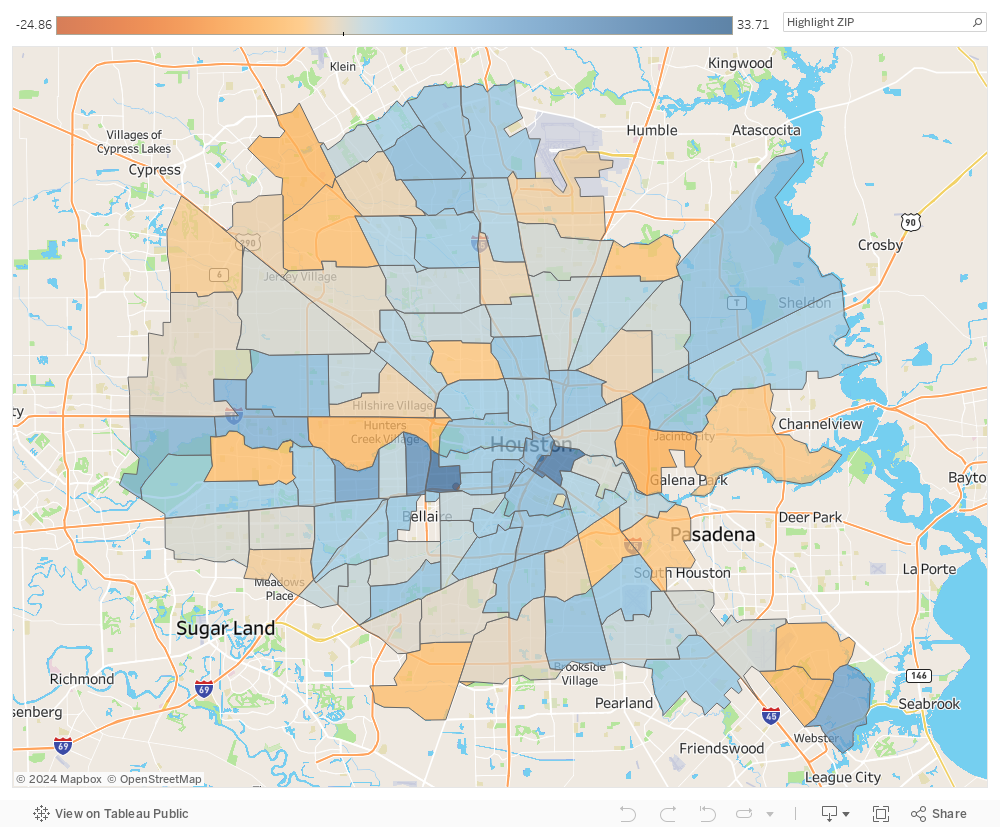
Map: Explore change in move-outs by ZIP code
The map colors ZIP codes in Houston city limits according to those that saw a decrease (orange) or an increase (blue) in net move-outs in 2020. For example, River Oaks ZIP code 77027 had an increase of 30 net move outs per 1,000 residents, one of the sharpest increases in the city.
Interactive by Mingming Zhang
Unfortunately, we do not have the data that would tell us exactly where these former Houstonians went, but other published reports suggest it is likely that the vast majority of movers stayed in the metro area.
Commercial real estate firm CBRE’s analysis of address-change data from 2020 suggests 85% of moves from the Houston-The Woodlands-Sugar Land MSA were relocations to addresses in the same metro, and 92% of moves were within the state of Texas. (The leading destinations outside the Houston metro were Dallas, Austin and San Antonio; the leading destination states outside Texas were Florida, California and Louisiana.) A similar analysis of address-change data by The Wall Street Journal found that counties bordering Harris County all had more move-ins than move-outs. These phenomena were fairly common among all metro areas, which saw more migration out of their city cores toward nearby suburbs and small towns.
Individual moves drove Houston’s exodus
Looking at the move-out data tells only one side of the story, of course; after all, higher net move-outs could also be an indicator of reduced move-ins.
Stephan D. Whitaker, policy economist for the Federal Reserve Bank of Cleveland, points out that across several metro areas he studied, the population loss for cities during the pandemic was driven more by a reduction in the number of people moving to cities rather than an exodus of city dwellers—a hesitance to move in, as it were.
For Houston, that might have been a factor for “family” household moves but not “individual” moves. (The Postal Service categorizes change-of-address requests based on whether they apply to an entire family–all the members of the household—or a single individual at an address.)
In 2020, there were about 5,100 fewer family move-ins than the year before (about a 7% decline), suggesting a hesitancy to take up residence in the city. However, there were also fewer family move-outs in 2020 than the year prior—suggesting there was not a great exodus of families at the same time.
Meanwhile, total individual move-ins increased by almost 23,000 (about 12%) over 2019. That increase, however, was outnumbered by a surge in move-outs by individuals, which numbered close to 29,000 (a 14% increase).
It seems the acceleration in move-outs from Houston was driven by individuals, as net move-outs for that group increased 54% year-over-year. It’s likely that this segment is dominated by renters, who can change housing situations more frequently than a homeowner.
Shrinking city?
The overall effect on the city of Houston remains to be seen, as it is difficult to estimate the actual population effect these moves had.
Of the 30,000 net move-outs in 2020, over 13,500 were classified as family moves. According to American Community Survey estimates, Houston averages 2.65 people per household. By that yardstick, the city might have lost 35,000 residents out of this cohort of families.
The remaining 16,900 net move-outs in 2020 were classified as individuals, who could have been single occupants or roommates not part of a family unit. All told, that puts the potential population loss around 52,000—about the equivalent of the city of Galveston or about 2% of Houston’s overall population.
Looking at it another way, Houston had about 860,000 total households in 2019, according to the American Community Survey. The Postal Service numbers suggest net-move outs affected up to 34 out of every 1,000 households.
This is merely a back-of-envelope estimate of a possible effect, however. We will not know the true city population until the 2020 Census data is released, which will take into account births, deaths and other demographic features that do not show up on Postal Service records. (Of course, even that data might carry an asterisk because of the pandemic.)
An accelerated trend
What does seem to be clear is an accelerating suburban shift. As this blog recently noted, the suburban counties around Harris County are now home to as many people as the city of Houston overall. That is the result of a demographic trend that has been underway for the greater part of the 2010s. Meanwhile, growth in Houston and Harris County slowed or stopped altogether in 2019 and 2020. (Houston is estimated to have lost 9,000 residents in 2019, according to the American Community Survey. In the same year, the city experienced over 20,000 net move-outs.)
A 2% hit to the population does not seem to be an “exodus,” but it is certainly a trend to watch. One thing that remains to be seen is just how permanent these moves are. The significant increase in home-buying last year suggests a good number of these moves are for the long term. But if more affordable housing options become available in the city, more residents, particularly renters, could move back. Moreover, as more workplaces resume in-office requirements, this could affect housing choices again.
If the urban core of Houston continues to lose potential and existing residents to its suburbs, one could expect to see even more housing development farther and farther out. The housing dynamic will be a key factor to watch under this shift. It is well established that housing is an important determinant of migration flows. Research has shown that in large cities, rising housing costs are associated with increasing outflows, as we are seeing here in Houston.