Since the beginning of the century, not much ground has been gained in improving the economic health of the nation’s most vulnerable communities. The gaps that exist between white and Black America in so many parts of life, from rates of homeownership and unemployment to median household income and life expectancy, aren’t shrinking.
In the past two decades, the number of Americans living in economically distressed communities hasn’t changed (it remains around 50.5 million) and over half of them are people of color. That’s despite the record economic gains the country experienced in recent years, before the coronavirus pandemic brought the economy to an abrupt standstill in March.
It’s already been shown that the pandemic recession isn’t hitting all Americans with equal force. Employment rates for high-income workers dropped to a low of around 14% in mid-April, but they’ve bounced back. As of Oct. 2, employment rates among workers making more than $60,000 a year had returned to pre-pandemic levels — down just 0.1% compared to January. That’s according to Opportunity Insights’ Economic Tracker, which also shows that employment rates for those making less than $27,000 annually decreased as much as 38% back in April before rebounding — but not completely. They’ve hovered around -20% since the end of June.
That gap in economic recovery between low-income and high-income workers during the pandemic takes on an added layer of concern when considering research that shows the Great Recession was hardest on African Americans — many of whom were still struggling to fully recover financially when the pandemic hit.
When it comes to income, poverty, joblessness and vacancy, the gap between distressed ZIP codes and prosperous ZIP codes held steady between 2000 and 2018, according to a recent report from the Economic Innovation Group (EIG). EIG researchers created a Distressed Communities Index (DCI) to examine how economic well-being is spread across ZIP codes and regions in the U.S. One of their key findings is that 70% of majority-Black ZIP codes are economically distressed. That statistic is especially troubling when considering only 20% of ZIP codes nationwide and 16% of majority-white ZIP codes are distressed.
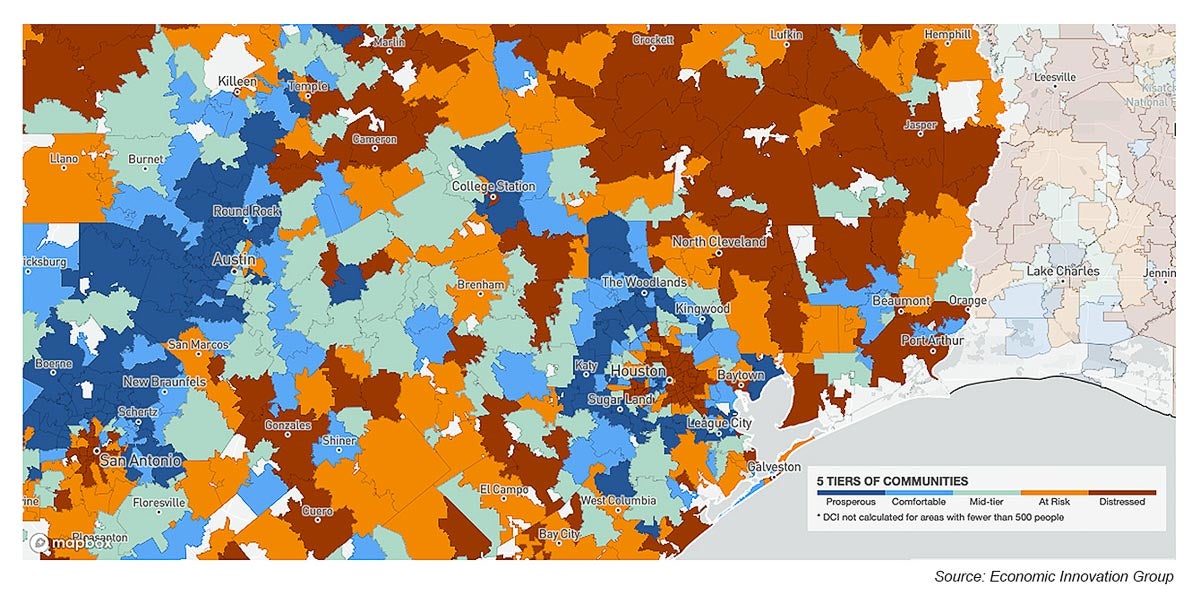
Using the U.S. Census Bureau’s American Community Survey 5-Year Estimates for the years 2014-2018 and the Census Bureau’s Business Patterns data sets for the same period, they looked at seven metrics that were combined to calculate a community’s score on the index. Communities are defined at the ZIP code level and scores range from 0 (most prosperous) to 100 (most distressed). Based on the score, communities were placed into one of five tiers of economic well-being: prosperous, comfortable, mid-tier, at risk and distressed.
The seven metrics used were no high school diploma, housing vacancy rate, adults not working, poverty rate, median income ratio, change in employment and change in business establishments.
To track long-term changes in economic well-being at the local level, a “DCI vintage” was established for each ZIP code using the 2000 census in addition to Business Patterns data from 1996—2000 to show changes in employment and establishments during that period.
Inequalities abound
The report finds racial inequality at every level of community well-being, “but especially in distressed areas, where the median household income for the typical Black household was only 66% that of the typical white household. Between 2000 and 2018, the typical Black median household income fell as a share of white MHI across every quintile.”
West University Place residents (77005) have an average income of $190,000, the highest in the Houston area. The ZIP code is 71.2% white.
At $27,500, the 77051 ZIP code — in the Sunnyside neighborhood — has the lowest median income. The ZIP code is 79.4% Black.
And in Houston, these racial inequalities also extend to the Hispanic population, which is twice that of whites or Blacks.
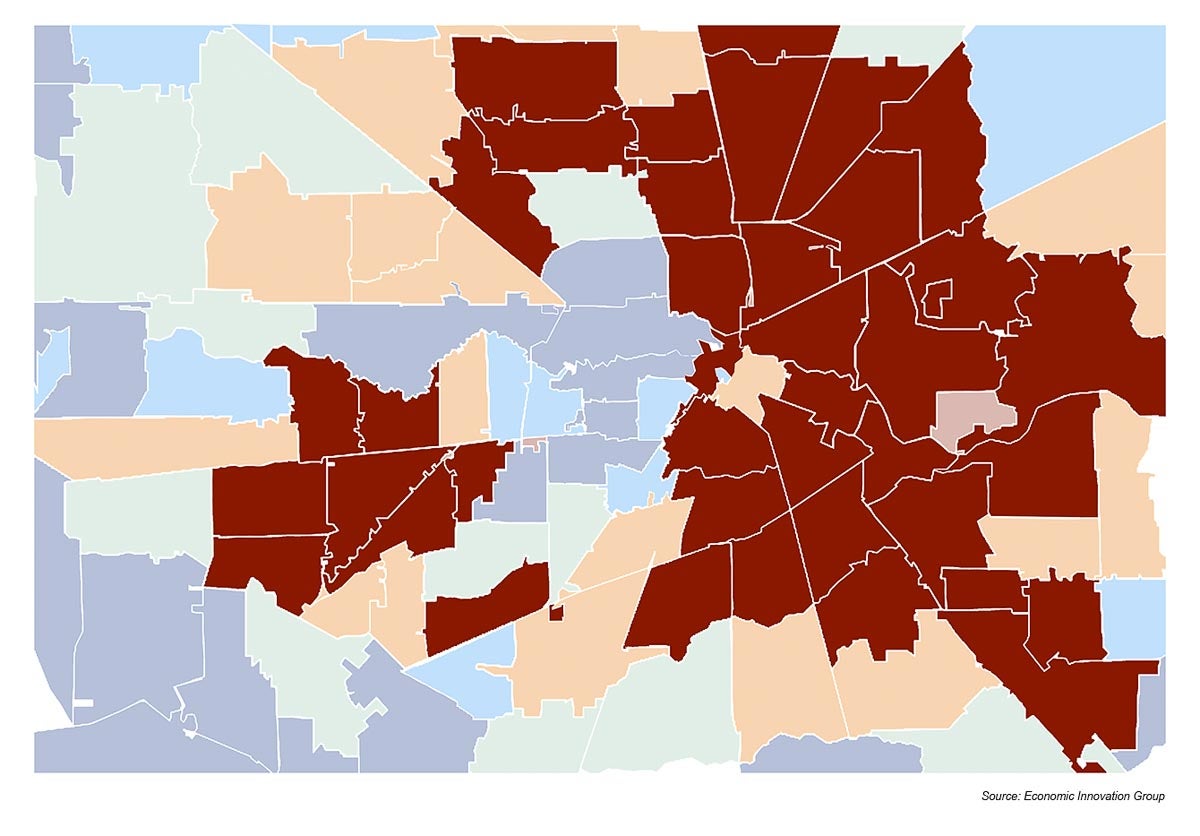
In Harris County, 45 ZIP codes are economically distressed — twice as many as the number of mid-tier, comfortable or prosperous ZIP codes in the county. Eight of the 45 distressed ZIP codes are majority-Black and 28 are majority-Hispanic.
Distressed ZIP codes form a giant backward “C” that wraps around the arrow of prosperous ZIP codes west of downtown. The “C” extends from the Langwood neighborhood, just beyond the North Loop West, all the way around to where Almeda Road and Airport Boulevard intersect, about three miles south of the South Loop West. There’s a 45-mile continuous stretch of distressed urban communities running north and south, from the Bamwood Terrace neighborhood in northern Spring Southwest down to Southbelt/Ellington, south of Beltway 8. And a 30-mile stretch of uninterrupted distressed ZIP codes that runs east and west from the southwest corner of ZIP code 77051 (east of Sunnyside) all the way to where Buffalo Bayou dumps into the Ship Channel on the eastern edge of the 77015 ZIP code.
Harris County’s most distressed majority-Black ZIP code is 77078 (East Houston), which has a DCI of 97.4. It has become more distressed since 2000, when its DCI was 89.9. Demographically, the ZIP code’s population is 58.1% Black, 38.3% Hispanic and 3.4% white. More than 27% of adults 25 and older do not have a high school diploma and the poverty rate is 20.6%. One-third (34%) of adults living in East Houston aren’t working (either unemployed or not in the labor force) and the housing vacancy rate is 10.3%. The median household income is $37,400 and almost 18% of residents are without health insurance.
From 2014—2018, the percent change in the number of employees working in the ZIP code was -22.8%.
There’s a 45-mile continuous stretch of distressed urban communities running north and south, from the Bamwood Terrace neighborhood in northern Spring Southwest down to Southbelt/Ellington, south of Beltway 8.
According to the Kinder Institute’s State of Housing dashboard, less than 22% of Black residents in Third Ward own their homes, despite the fact the neighborhood’s population is 65% Black. In the Sunnyside neighborhood, 80% of residents are Black, but less than 40% are homeowners. The homeownership rate is the same in OST/South Union, where 79% of residents are Black.
Among the majority-Black ZIP codes in Houston, three are distressed and have become increasingly distressed in the past two decades: 77016 (from 91.7 in 2000 to 97 currently), 77078 (from 89.9 to 97.4) and 77028 (85.4 to 87.5). These three areas form a cluster to the northeast of downtown.
On the south side of downtown, four majority-Black ZIP codes are distressed but improving: 77004 (from 90.3 2000 to 82.4 currently), 77021 (95 down to 85.4), 77033 (95.4 to 81.4) and 77051 (96.1 to 83.3).
The most distressed majority-Hispanic ZIP code is 77060 in the Greater Greenspoint area, with a distressed score of 99.2. That’s an increase from a DCI of 95.3 in 2000. The poverty rate is 33.6%, 27.6% of adults aren’t working, the housing vacancy rate of 15.5% and 43.5% of adults 25 and older do not have a high school diploma.
In the five years between 2014 and 2018, the number of employees working in the ZIP code decreased by 22.3%. And the median household income is $30,300.
Racially, the population of 77060 is 75.5% Hispanic, 16.2% Black and 5.5% white. Only 23.7% of residents are homeowners.
The gap in household income and homeownership, along with limited access to opportunities such as education, health care and quality affordable housing, form the aggregate inequality in America that limits many Black and Hispanic communities. And, unfortunately, as long as these large disparities exist, those-who-have continue accumulating more and more while those-who-don’t-have remain trapped in a struggle to make it week to week. Without the ability to build wealth, they don’t have the luxury of becoming entrepreneurs or gaining the traction necessary for upward mobility.
Economic decline in rural areas
No majority-white ZIP codes in Houston or Harris County are distressed, according to the EIG report. To find one in the Houston region, you have to look beyond the prosperous and comfortable suburban ZIP codes that form a ring around the city, outside of Beltway 8. To the south, there’s Bacliff in Galveston County and Liverpool in Brazoria County. To the north, there’s Willis in Montgomery County, and Liberty, Cleveland and Hull in Liberty County. And to the east, there’s Anahuac in Chambers County.
Across the nation, as the distressed communities index report reveals, “geography is closely tied to economic well-being, and place seems to matter more than ever.” Since 2000, the geography of economic well-being has changed drastically and, as a result, many rural areas and small towns have seen economic decline. Like most metro areas in Texas and across the country, the ZIP codes beyond the Greater Houston area create a patchwork of red (distressed) and orange (at risk).
Prosperity in the suburbs
The number of Americans living in prosperous urban ZIP codes has doubled since 2000, but the advances weren’t consistent across all large cities. Cities in the West saw the most improved well-being, but in 61 of the 100 largest cities, the number of prosperous ZIP codes plateaued or decreased.
Despite economic improvements seen in urban areas, the suburbs are home to the most prosperity.
“These ZIP codes capture much of the wealth generated in the country’s metropolitan hubs,” according to the EIG researchers. “Fully two-thirds of all suburban ZIP codes in the United States rank as prosperous or comfortable on the DCI.”
In Houston and Phoenix — sprawling Sun Belt cities — much of the economic growth flows out to suburban areas and has done “little to lift many chronically distressed urban neighborhoods.”
West University Place may have the highest median income among Houston-area ZIP codes, but it doesn’t have the lowest — read, most prosperous — DCI index. Those ZIP codes are found in the region’s suburban areas.
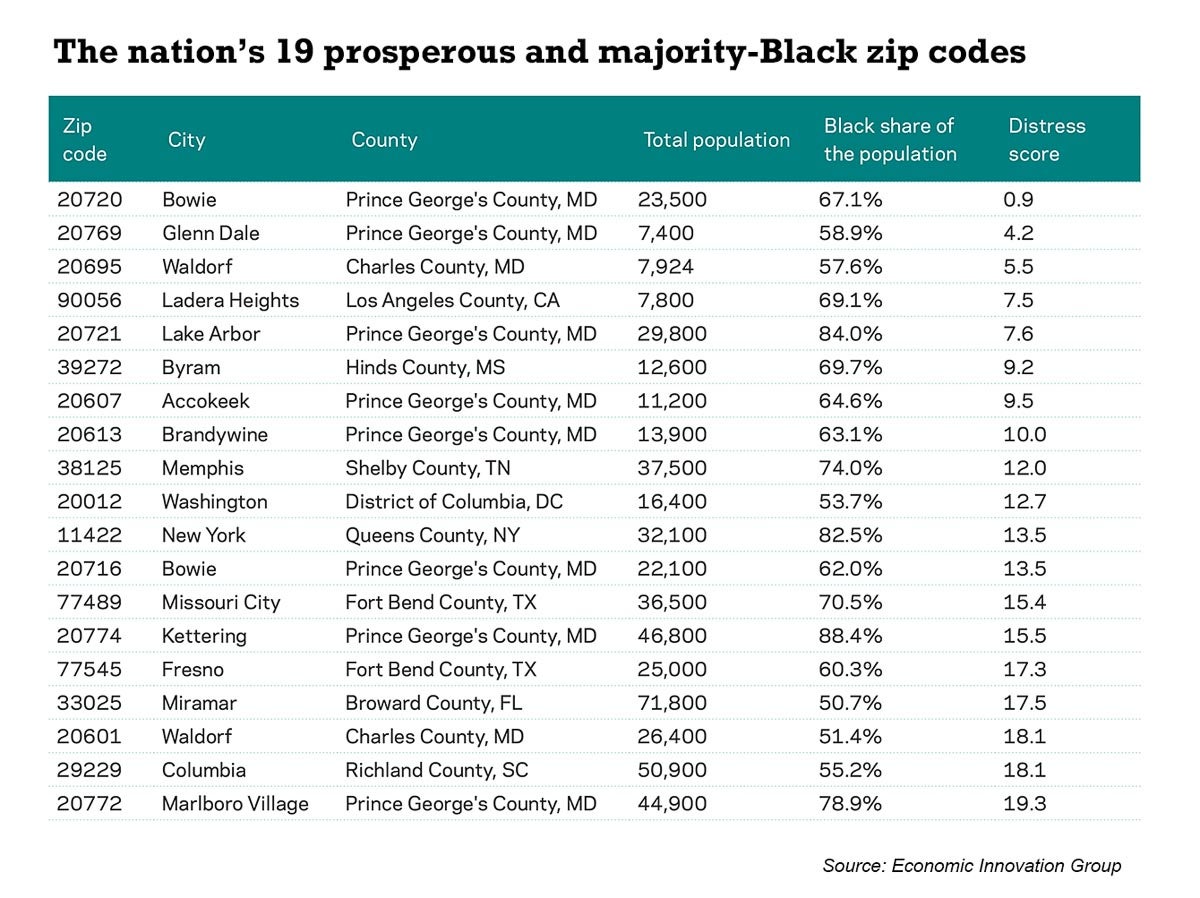
Fresno (77545) and Missouri City (77489) in Fort Bend County are two of only 19 ZIP codes in the entire nation that are both prosperous and majority-Black. Of those 19 ZIP codes, 11 are in the Washington, D.C., area.
The population of the 77489 ZIP code in Missouri City, which has a DCI score of 15.5, is 70.5% Black or African American. The median annual income is $66,400 and about 60% of residents are employed in management and professional or sales and office jobs. Fresno has a DCI of 17.2 and 60.3% of residents are Black or African American. In 2000, the 77545 ZIP code had a DCI of 45.9, which is the mid-tier category of economic well-being. Most residents work in management and professional, sales and office or service industry jobs, and the median annual income is $79,900.