
If you’ve had the coronavirus, does that protect you from being infected again? And if so, how long does that immunity last?
Doctors, researchers and public health experts have been chasing down answers to these questions since the beginning of the pandemic. And large-scale, random testing for COVID-19 antibodies can help provide the answers. The test looks for SARS-CoV-2-specific antibodies in a blood sample — they’ll show up if a person has had the coronavirus. While one-off or individual antibody testing is of no real use, broader, random testing reveals the prevalence of COVID-19 in cities such as Houston.
“[The data can be used] to estimate the cumulative incidence of the virus across Houston,” says Dr. Pedro Piedra, a professor of molecular virology and microbiology at Baylor College of Medicine. “This allows us to better understand the extent of transmission — information critical to making decisions about prevention and control strategies.”
Those strategies include protective measures such as social distancing, good hygiene, isolation and restrictions on businesses and movement, as well as remote learning instead of in-person classes.
Repeated over time, antibody testing can show a community’s progress toward herd immunity, which is reached when enough people have been infected and are immune to COVID-19 that its spread effectively is stopped. Many experts say 70% of an area’s population needs to be infected to achieve herd immunity, but other, more hopeful researchers think it might require only about 50%.
Like a lot of things about COVID-19, the duration of antibody detection for those infected for the first time is unknown, according to Piedra.
“We expect that it will decline over time and that repeated infections will eventually establish a stable antibody level,” he says.
An analysis of more than 30,000 blood samples taken from Icelanders provided some encouraging findings, showing antibodies increased for two months after a COVID-19 diagnosis before leveling out and lasting for four months — much longer than what some earlier studies had indicated.
Antibodies 101
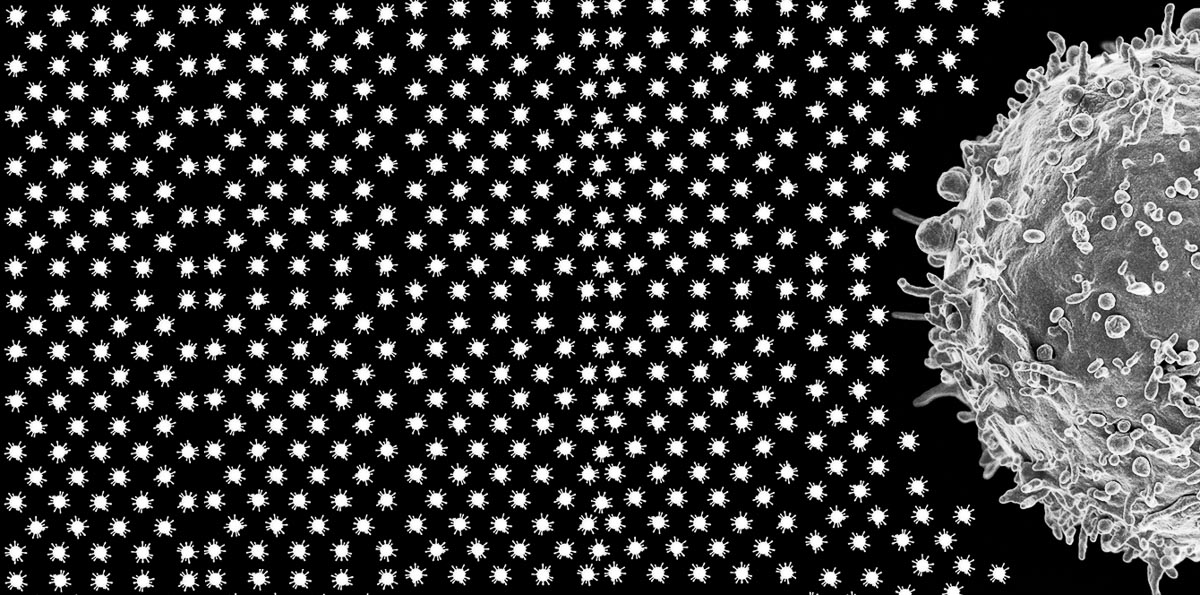
Antibodies are produced by the immune system’s B cells to protect us from invaders such as bacteria and viruses. Basically, B cells make antibodies that bind to viral intruders and stop them from hijacking healthy cells and turning them into virus-producing machines, so to speak. T cells also are important in the body’s defense. Some, known as helper T cells, seek out abnormal cells and trigger a B cell intervention; while killer T cells find and directly attack cells infected by viruses.
After someone has been infected with a virus such as SARS-CoV-2, their immune system goes to work. If all goes well, their body fights off the infection and they get better, but the antibodies remain to protect against reinfection — for a while, at least. However, even after the antibodies are gone, B and T cells, which have really good “memories” and still “recognize” the coronavirus, remain.
Random sampling is important to understanding prevalence
About a month ago, the New York City Department of Health released the results of almost 1.5 million coronavirus antibody tests, which indicated lower-income communities — often communities of color — had a higher prevalence of exposure to COVID-19 than more affluent areas of the city.
Near the bottom of a New York Times’ story about the test results, under a subheading that read, “The data still has limitations,” Joseph Goldstein wrote that most of the more than 1.46 million antibody tests “were done for people seeking them out, which means that those who got tested are a self-selecting group and not a random sample.”
That doesn’t mean the New York testing data is altogether useless. For example, there’s little doubt that in Corona — a predominately Hispanic neighborhood in Queens — more than 50% of residents who were tested received positive results, while “no ZIP code south of 96th Street in Manhattan” had a positive rate of more than 20%. However, antibody test results from a random sample of residents is much more ideal in obtaining the most accurate estimate of COVID-19’s prevalence.
Study sample designed to eliminate bias
That’s currently happening in Houston, where a random sample of households from across the city is being asked to participate in an antibody testing survey conducted by the Houston Health Department (HHD). The scientifically designed study should provide officials with a precise understanding of the disease’s prevalence in Houston.
“It’s the gold standard of scientific evidence,” says Kathy Ensor, a professor of statistics at Rice University, who designed the sample. “When we’re looking at all these dashboards and case counts and everything, those are based on people volunteering to be tested. So, there’s a really strong selection bias in that information. By having this (scientifically) designed study, we can collect scientifically sound and representative information.”
The study, which takes place in two phases, is funded by the Centers for Disease Control and Prevention (CDC), and was designed by Rice University researchers. One of the two antibody tests being used was developed by Baylor College of Medicine, which also is part of the collaborative testing effort.
“We’re randomly selecting census block groups and randomly selecting households within a census block, we have what we call a probability-based sample for the region,” Ensor explains. “We will be able to take the information collected from these samples and come up with a citywide estimate of COVID-19 prevalence.”
First, two stratum of census block groups were selected — one group with higher observed levels of COVID-19 and another composed of census block groups with lower positivity rates. Then, 30 census blocks from each of those groups — a total of 60 — were selected. From a list of all occupied households in those 60 census blocks, seven households from each census block were randomly chosen, according to Ensor, for a total of 420 households. Those households are being approached in phase one of the survey, which began Sept. 8 and is slated to conclude Sept.24, and are being asked to fill out a questionnaire and provide a finger-prick blood sample for testing. Everyone within a household is invited to participate, including children ages 5 and over.
Second part of study begins next year
The information gathered in the first phase of the survey could better reveal what regions of the city or communities are most impacted by COVID-19. It all depends on the data, says Ensor, who oversees the Kinder Institute’s Urban Data Platform.
In early 2021, phase two of the survey, phase one participants who tested positive for antibodies will be invited to be retested. Retesting will provide information about how long — and at what level — people maintain COVID-19 antibodies over time. In addition, the sampling process will be repeated to choose a second cohort of 420 households “to again estimate the overall prevalence of COVID in our community,” Ensor says.