
In 1910, when Lyndon Baines Johnson was a 2-year-old living on his family’s farm in the Texas Hill Country, just under 92 million people called the United States home. People of color comprised 11% of the total population. In Texas, people of color made up 21.5% (691,000) of the state’s 3.2 million residents.
Fast-forward to 1965, when Johnson, then a 57-year-old living in the White House, signed the Immigration and Nationality Act — the Hart-Celler Act — in a ceremony at the feet of the Statue of Liberty. The transformative law helped remake America in the 20th century by removing restrictions that limited immigration from Asia, Africa, Southern and Eastern Europe and the Americas, while favoring immigrants from Northern and Western European countries.
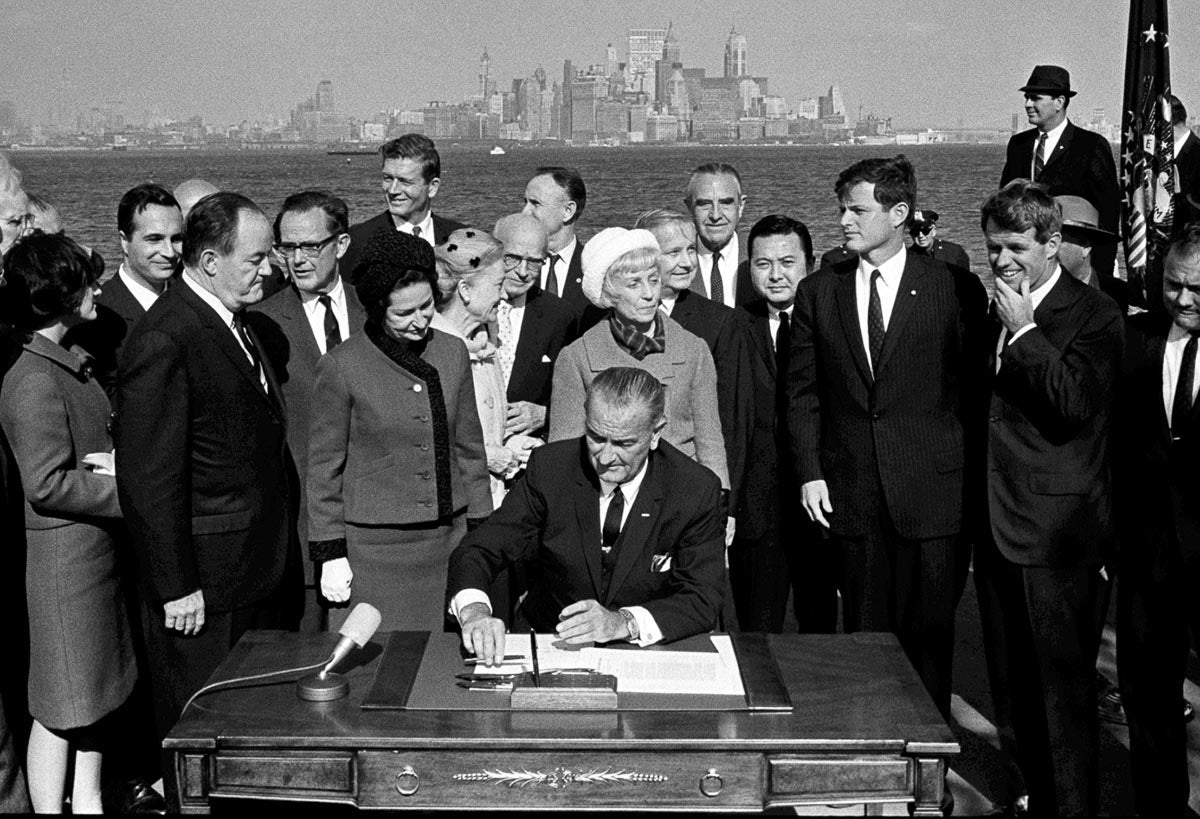
On Oct. 3, 1965, at the base of the Statue of Liberty, President Johnson signed the Immigration and Nationality Act, also called the Hart-Celler Act, which was a radical departure from the discriminatory immigration policy that, for the previous 40 years, had barred non-whites and those who wanted to come to America from Asia from entering the country.
Source: LBJ Library photo by Yoichi Okamoto
The population of America had grown by about 100 million since 1910, totaling around 193 million in 1965, but it remained overwhelmingly white. People of color made up just 13% of the population — roughly the same portion as 55 years earlier. In 1960, 84% of immigrants living in the U.S. were from Europe, Canada or other North American countries such as Cuba, according to the Pew Research Center. At that time, 6% of immigrants were from Mexico, 4% were from Asia (Central, East, Southeast, and South Asia) and 3% were from Latin America (Central America, South America and the Caribbean).
President Johnson and others couldn’t anticipate the enormous impact the Hart-Celler Act would have on the demographics of America in the 55 years that followed. By 2018, only 13% of the foreign-born population in the U.S. were immigrants from European countries, Canada and other North American countries. While more than three-quarters of the immigrant population came from Asia (28%), Mexico (25%) and Latin America (25%).
“America’s color began to change in October of 1965,” Thomas J. Sugrue, a specialist in 20th-century American politics, urban history, civil rights and race, told a webinar audience during his recent presentation as part of the Rice Architecture Fall 2020 Lecture Series. “At the same time that Lyndon Johnson signed the Hart-Celler Act that transformed immigration, he also signed the Voting Rights Act, which extended voting rights to African Americans, as well as to Americans whose native language was not English — an important refinement that would grow in significance as immigration changed.”
Today, approximately six in 10 Americans are white. Almost 12.5% of the population is Black, a slight increase from the 1960s, around 17.4% is Hispanic and close to 5.5% is Asian.
In 1960, the population of Texas was 87.4% white. Now it’s half that, at 42.3%. The state’s African American population has decreased slightly since 1960, from 12.4% to 11.7%, and more than 39% of the population is Hispanic.
As Stephen Klineberg has documented so well over the past 40 years with the Kinder Houston Area Survey, the city’s growth since the turn of the 19th century has been both sustained and dramatic. Between 1900 and 1910, it experienced a 77% growth spurt and went from being the nation’s 85th largest city in 1900 (population 44,633) to the 68th largest in 1910, with 78,800 residents. By 1960, Houston was the 7th largest city and had a population of nearly 1 million — 77% of which was white and 23% was African American. (That adds up to 100%; however, in the mid-1960s, Sugrue points out, with the exception of a few areas of the country or a small number of urban neighborhoods, Hispanics and Asians were mostly “invisible.”)
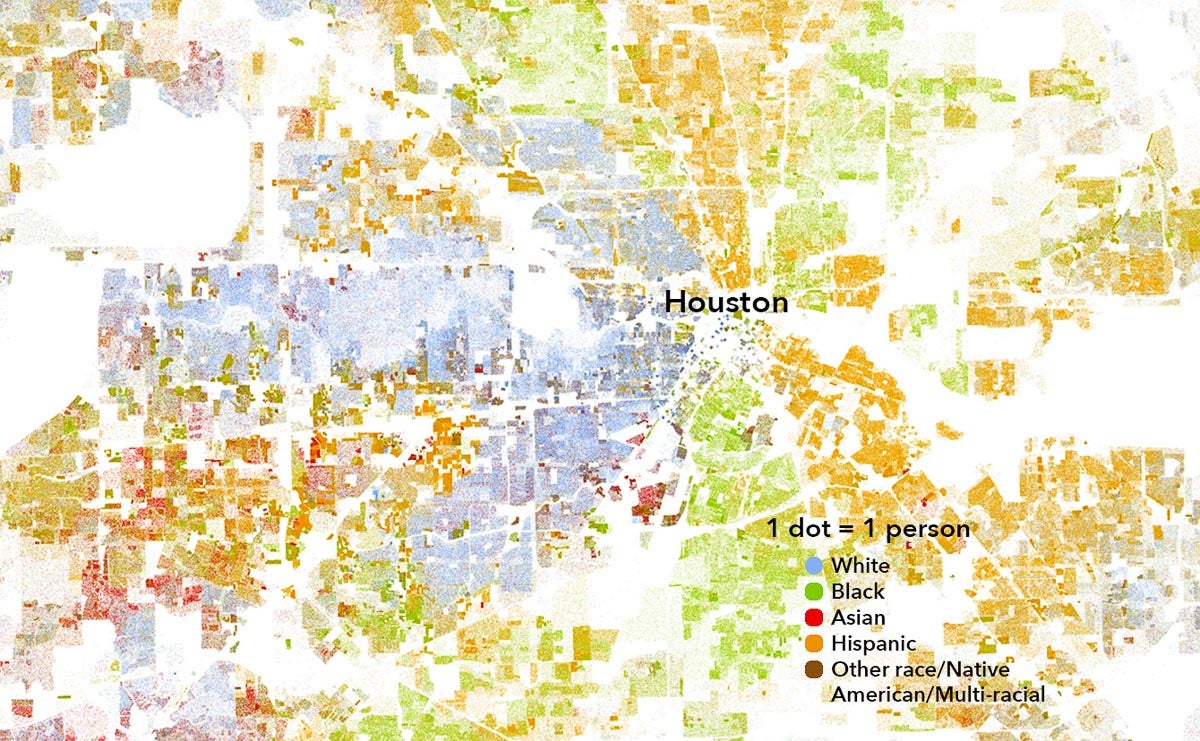
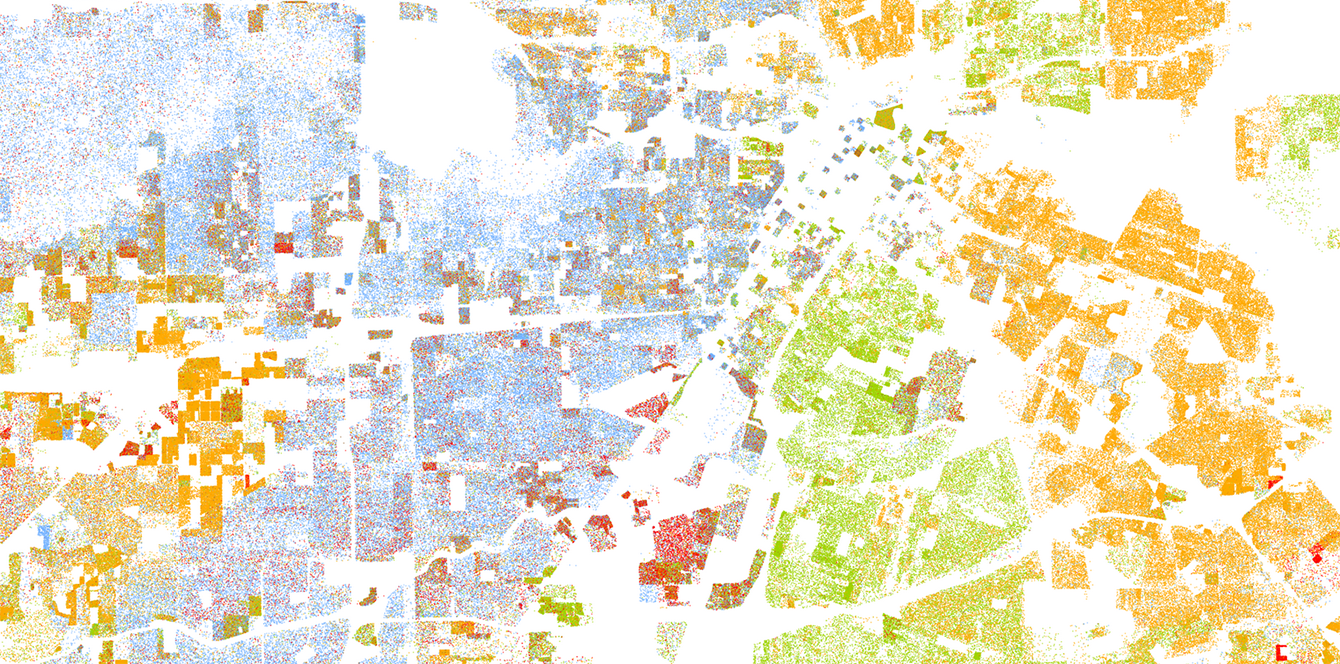
This image, which comes from a racial dot map, shows the diversity of Houston's population, as well as its segregation. The map was created by a demographic researcher at the University of Virginia’s Weldon Cooper Center for Public Service. All of the data displayed on the map are from the U.S. Census Bureau 2010 Summary File 1 (SF1) dataset.
Image Copyright, 2013, Weldon Cooper Center for Public Service, Rector and Visitors of the University of Virginia (Dustin A. Cable, creator)
In the time since the Hart-Celler Act was signed, the city has continued to grow, but it’s undergone a radical change in demographics as well. Houston was about 55% white, 27.6% Black and 17.6% Hispanic in 1980. Today, the population is 24.5% white, 22% Black, about 7% Asian and nearly 45% Hispanic.
And while Houston’s population has diversified immensely, the surrounding suburban cities and counties in the metropolitan area have seen even greater changes in composition. Sugrue says the increase in suburban diversity in the U.S. is “perhaps the most unexpected transformation of the last half-century.”
More than half of Hispanic immigrants to the U.S. start off in the suburbs or move to those areas within five years, Sugrue notes. The same goes for most Asian immigrants. And half of African Americans, once a group mostly excluded from suburbia, now live there.
In 1980, the Houston Metropolitan Statistical Area was 18% African American, 14.6% Hispanic and 67% white. A decade later, it remained 18% African American, but the percentage of Hispanic residents had increased to 20.8%, and Asians made up 3.6% of the population. By 2010, the Houston region was 34% Hispanic, 41% white, 17% Black and 6.3% Asian. Today, the population is 35% white, 38% Hispanic, 17% Black and almost 8% Asian.
On paper, these demographics look very diverse, especially compared to 40 years ago, and they are, but that doesn’t mean segregation doesn’t exist. That’s not a uniquely Houston problem. Residential segregation can be seen in other large metropolitan areas, including New York, Los Angeles and Chicago.
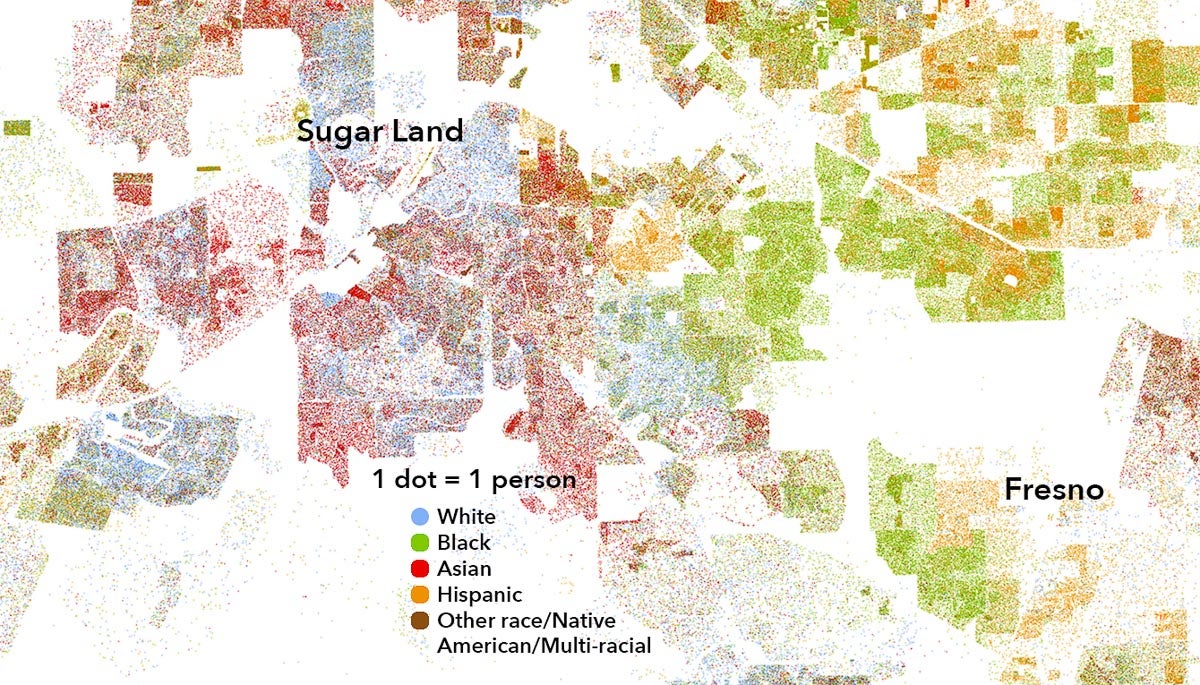
Source: Image Copyright, 2013, Weldon Cooper Center for Public Service, Rector and Visitors of the University of Virginia (Dustin A. Cable, creator)
“Americans might, in principle, at least, value diversity,” Sugrue says. “But in practice, they continue to live separate lives, even in these incredibly diverse metropolitan areas.”
Residential segregation, Sugrue says, creates what sociologist Charles Tilly called durable inequalities. It also leads to a phenomenon that Tilly called opportunity hoarding.
“Opportunity hoarding means that those with the most resources, whether it be public goods, or education, or real estate values, tend to hoard it together in particular places, it’s spatialized,” says Sugrue.
People of color represent 39% of the U.S. population, yet they make up more than 56% of the population of the nation’s economically distressed ZIP codes, according to a Distressed Communities Index released in October. Communities of color in the Houston area and across the nation are considerably overrepresented in the ZIP codes that are the most vulnerable.
“In America, where you live determines your access to jobs, your transit options, the quality of public services, how much you pay for them in taxes, your educational opportunities, your health, your relationship to the police and your personal security, just to name a few,” says Sugrue, who underscores the fact that, in the past 50 or so years, African Americans are the group whose advantages have increase the least. Even as attitudes about race continue to improve and evolve, both at the national level and, as the Kinder Houston Survey has shown, at the local level, African Americans are still segregated in a lot of places in the U.S.
The crises of 2020 — the continued killing of Black Americans by police, the COVID-19 outbreak and the social, economic and health disparities related to the coronavirus pandemic — have brought new and renewed attention to the inequalities that have existed in America for 400 years.
Sugrue says these racial inequalities in American cities and suburbs have spatial origins, including the redlining maps of the 1930s that shaped federal housing policy for decades and continue to dictate “residential patterns by race and ethnicity across our metropolitan areas.” There are also the boundaries of school districts and separate tax bases. These are “invisible lines that are as hard as walls.” Property values determine school district funding, and vice versa, Sugrue points out.
“The America that dawned in the post 1960s period, the America of our last 50 years, is far more diverse, but not inclusive or equal. We can celebrate the diversification of metropolitan America, particularly the diversification of suburbia, but we have to pay attention to the ways in which the last half-century has been one of gains and setbacks, of expanding opportunities and still-wrenching injustices of disadvantages by race and ethnicity, sometimes overcome, but just as often intensified or compounded and worsened.”