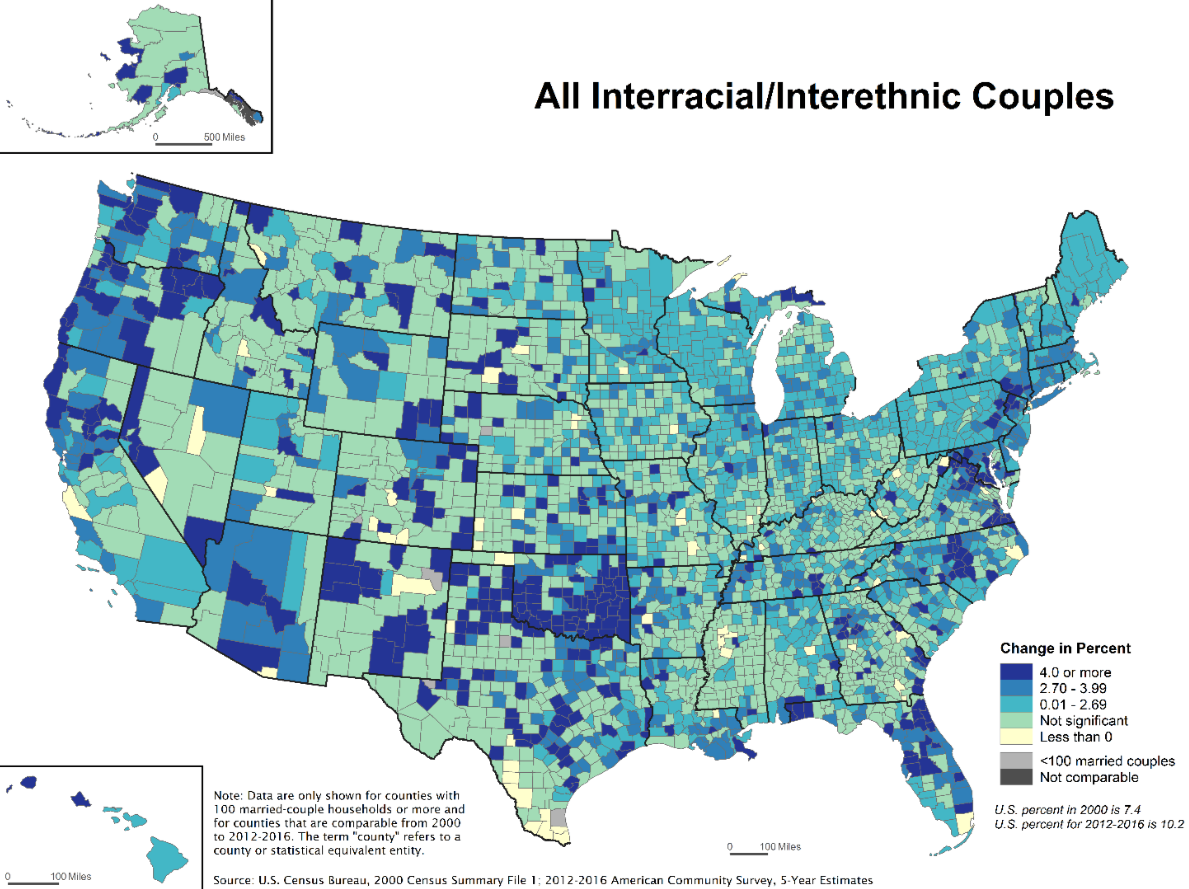
There's been a steady increase in the share of intermarriages, which include both interracial and interethnic marriages, over the past several decades. And that's continued into more recent years, but with important variations between counties and metropolitan areas. So while the overall share of married-couple households with spouses from different racial or ethnic backgrounds went from 7.4 to 10.2 percent between 2000 and 2012-2016, according to an analysis by family demographers at the Census Bureau, that number varied by county with some areas driving more of the change than others.
In fact, the rates in more than half of the counties included in the analysis did not have significant changes one way or another. Only 13.5 percent of counties saw their share of intermarriages grow by 4 percent or more, including three in the Houston area: Galveston, Chambers and Montgomery County. Waller and Brazoria counties, meanwhile, saw an increase of 2.7 to 3.9 percent, along with 15 percent of counties nationwide. Harris and Fort Bend counties, known for their diverse populations, showed smaller increases, between 0.01 and 2.69 percent, according to the analysis.

Intermarriage rates change from 2000 to 2012-2016.
U.S. Census Bureau
Increasing diversity and changing attitudes toward intermarriage are often cited as reasons for the increase but the relationship isn't always one to one. So in the Houston metropolitan area, one of the most diverse in the country, where surveys suggest the vast majority of folks approve of a family member marrying someone of a different background, the intermarriage rate among new marriages fell below dozens of other metropolitan areas, according to a recent analysis by the Pew Research Center.
There are a lot of possible explanations for that, including historical and ongoing segregation and even the area's diversity itself, which may offer more opportunities for people to marry someone of their own background.
The county-level rate of change also speaks to the shifts currently happening in some of Houston's suburbs that have yet to see the kind of demographic change that Harris County or Fort Bend County has. Recent estimates from the Census Bureau showed that Montgomery County, for example, experienced much faster change than the more populated Harris and Fort Bend counties:
Some of the most dramatic change has been in Montgomery County, the third largest in the metropolitan area. While still very white, the county has had fast growing Asian, black and Hispanic populations, both between 2016 and 2017 and 2010 and 2017. The Asian, black and Hispanic populations there increased by 9, 8 and 6 percent respectively between 2016 and 2017. Offering another view of the trend, between 2010 and 2017, those numbers were 74, 48 and 41 percent, well above the county's growth rate for that period.

