
When you try to show diseases on maps, they often start to look a lot alike, regardless of the disease being discussed.
Whether mapping respiratory health, heart attacks or other conditions, the diseases – at least when mapped in a localized area – tend to follow similar patterns. That’s because the conditions that tend to correlate to one health effect are often linked to many.
In the latest project from the Kinder Institute’s Urban Health Program, we present a series of maps showing the prevalence of various health conditions across the region in an effort to help leaders understand the nuances of those patterns.
After all, if you want to understand the health of a city, it helps to see it.
“You want to understand where to devote resources and strategies, and you’ve got to know where those problem areas are so we can get the right resources to them,” said Justin Denney, director of Kinder Institute’s Urban Health Program.
The data behind the maps come from the University of Texas, Health Sciences Center in Houston, with funding support from the Houston Endowment. The maps show the rate of various health conditions in neighborhoods and zip codes. Other maps also show demographics of Houston neighborhoods.
Even though some of the maps have similarities, they tell a compelling story about the nature of health in our region.
One map that’s particularly revealing shows the prevalence of asthma across the Houston area.

Right off the bat, we can tell that asthma isn’t evenly distributed throughout Houston.
Between 2010 and 2014, the frequency of asthma was higher in the city core, relative to adjacent communities of the Houston metropolitan area. Prevalence of asthma was the highest within the city limits, particularly in the eastern and northern parts of Houston.
If you look at some of the darkest portions of the asthma map, you can tell that they’re near the Houston Ship Channel. It’s no surprise that many people who’ve seen these maps have focused on the role that industry may play in contributing to asthma in those areas.
But there are other places worth close examination too. For example, if you look at the center of the map and follow it north, you can also see a similar pattern of heavy concentration of asthmatic residents. Those areas are not located close to the Ship Channel and industry on the east side of Houston. Why is that?
The map below shows poverty rates in Houston neighborhoods. It’s not difficult to see that in many areas, poverty concentration and asthma seem to sync up.
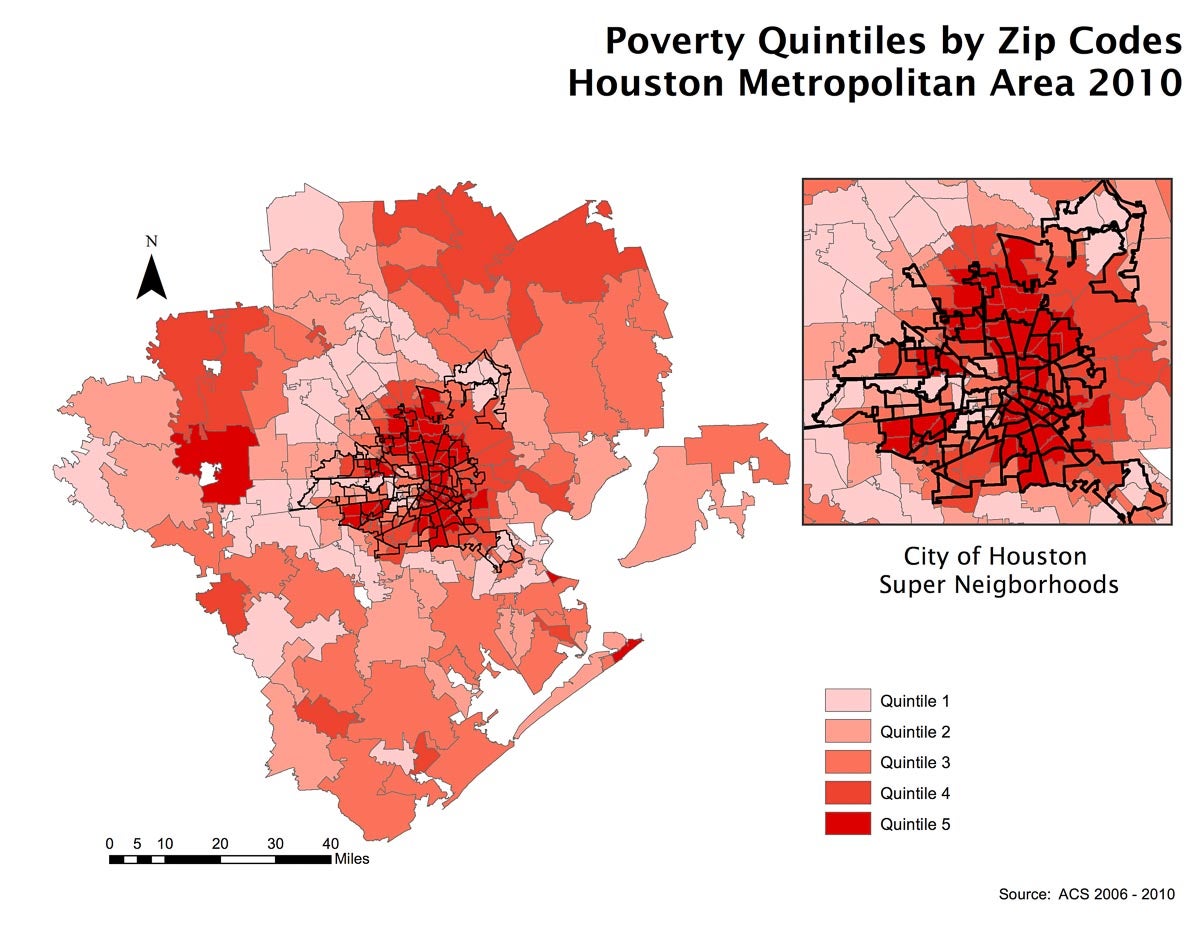
We also see another interesting trend. Outside the city limits, poverty declines and asthma rates still are relatively high. It’s not just the Ship Channel and nearby industry that may be linked to asthma trends, nor is it poverty. Something else is happening.
The third map, shown below, shows the concentration of particulate matter found in the air across the region.
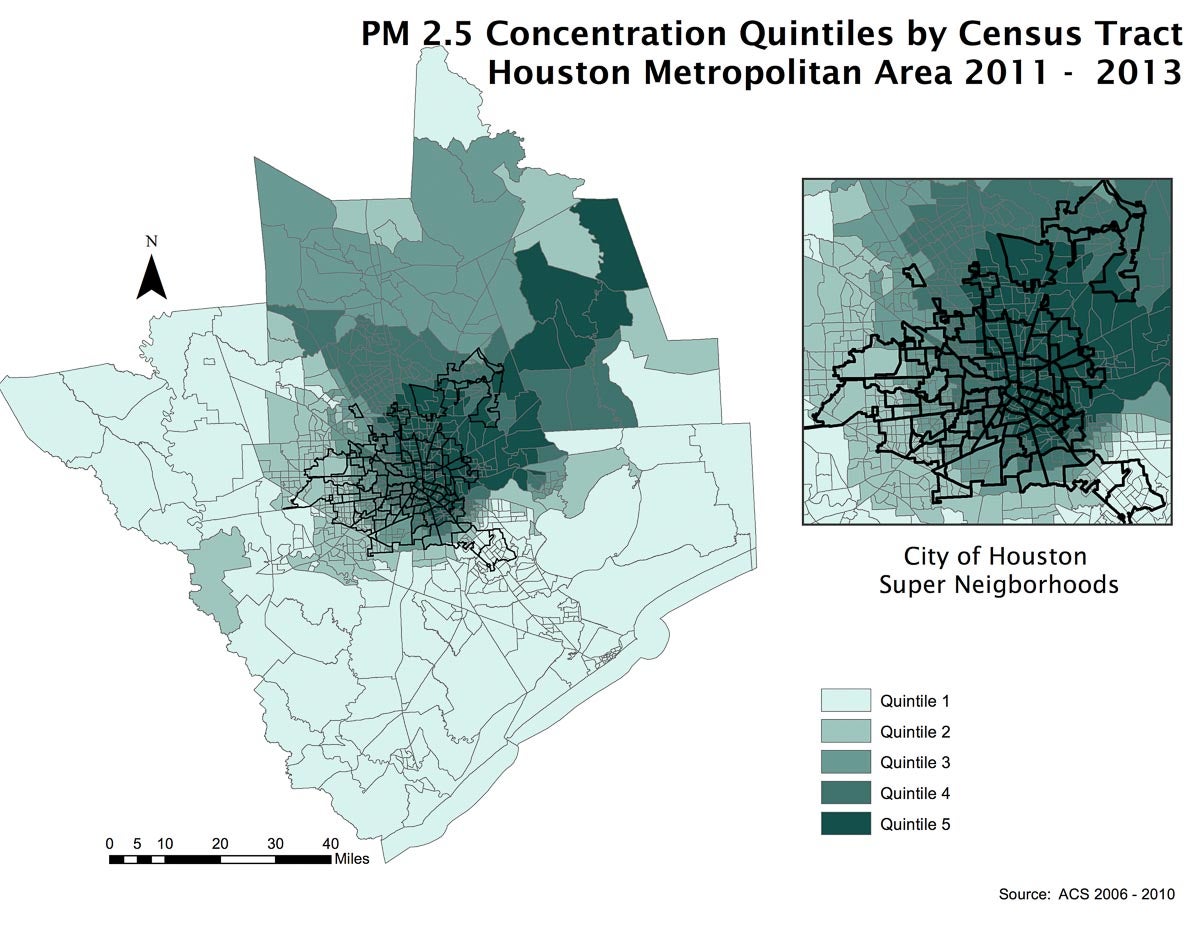
In general, urban spaces have more sources of particulate matter than rural places. The map clearly shows that particulate matter levels are highest in the north and east and lowest in the south and west. You can also see that in many areas with high levels of particulate matter, there are also elevated asthma rates.
“Poverty and particulate matter are similar in the sense that they both have physiological effects on health,” Denney said.
He speculates that asthma in the northern part of the city might be a confluence of wind patterns, traffic congestion or airplane traffic, and social and economic factors – but much more research is needed.
“It’s enough to make us want to think and wonder about how much is asthma linked to poverty and how much is it linked to the air we’re breathing,” Denney said. “That’s what we’re trying to figure out.”
Denney said it’s also important to focus on understanding anomalies that appear in the maps. Particulate matter, poverty and asthma are clustered together. What may be revealing is trying to understand more about where they diverge.
“If you want to know what the problems are, you’ve got to locate them and systematically examine the importance of them in a variety of contexts,” Denney said.