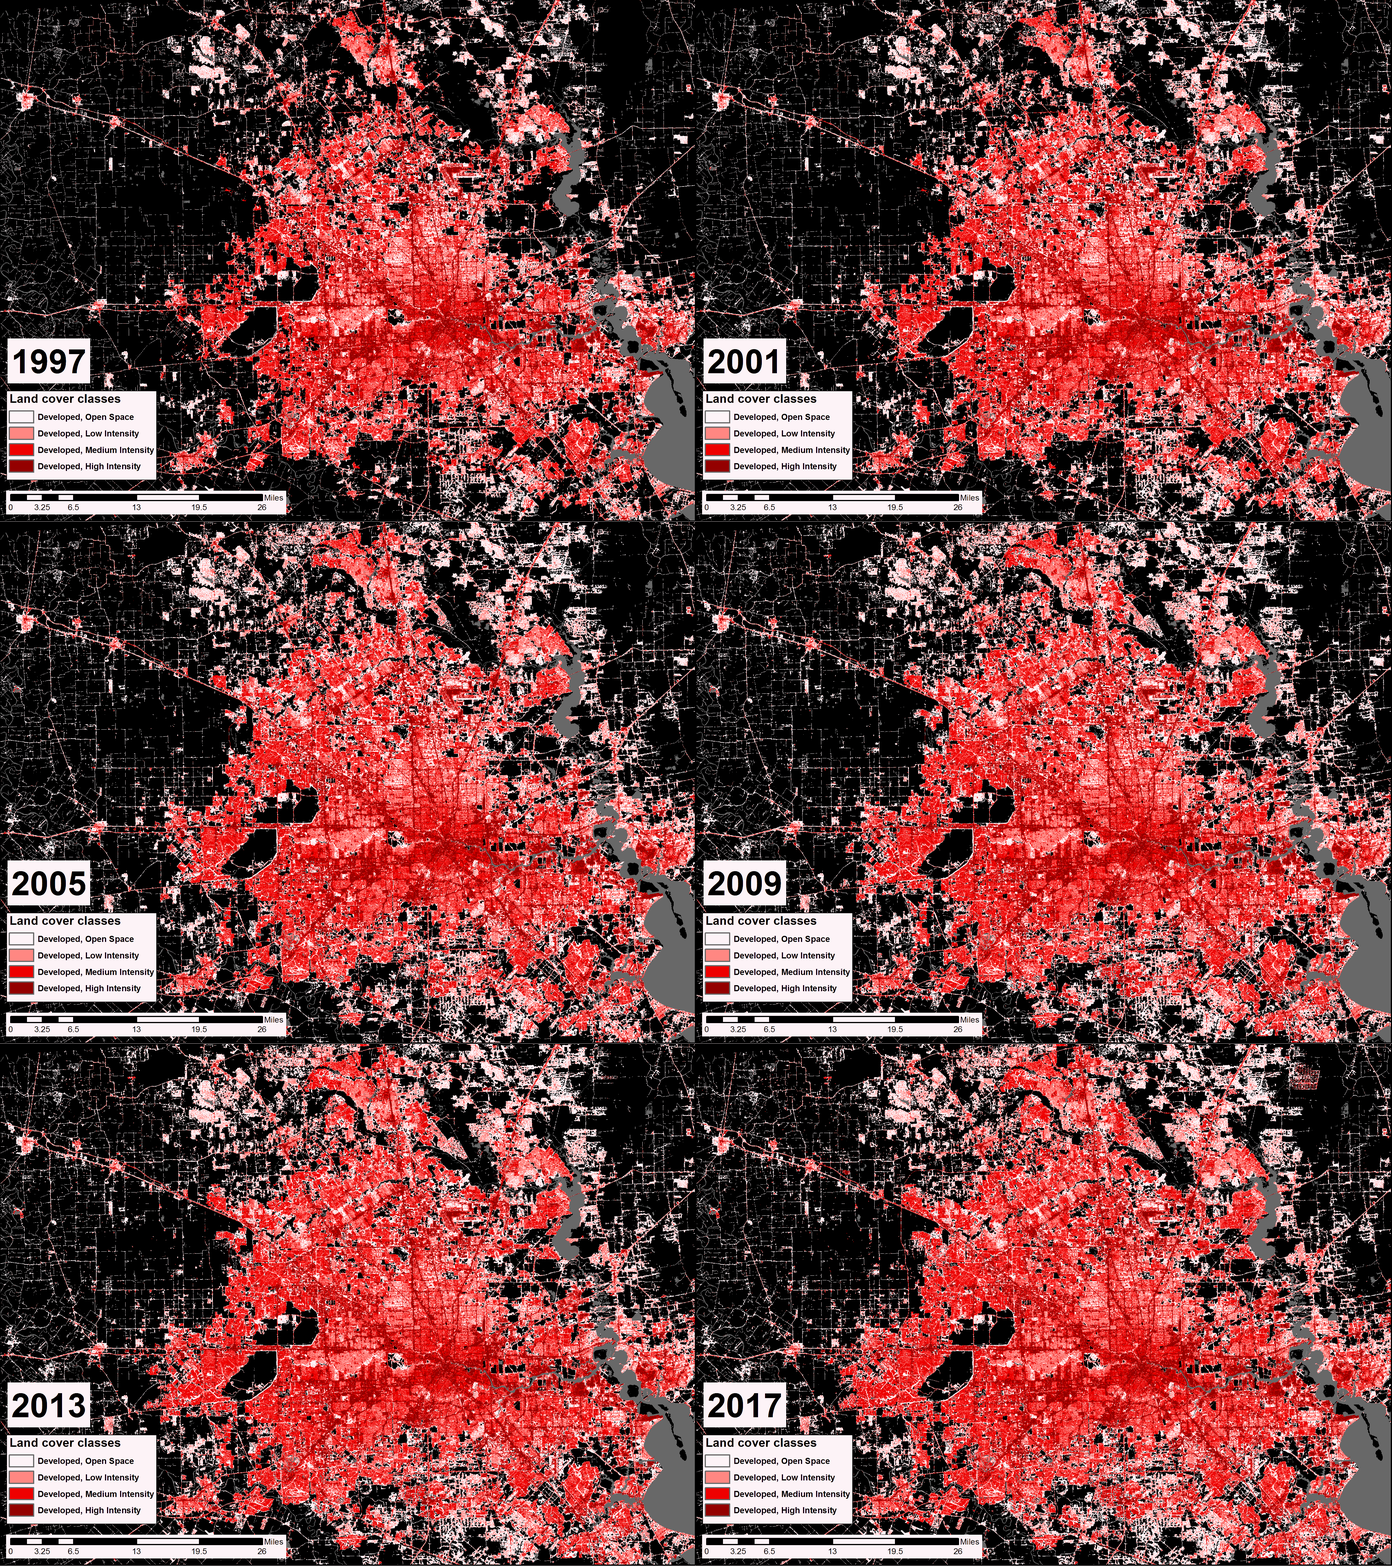
Houston, Harris County and the larger 13-county metropolitan area have been known as high-growth places for years. But after Harvey, the area's growth was in the national spotlight, often for negative reasons; it was too unregulated, too impermeable and too vulnerable, being built in flood-prone areas, according to the experts.
But actually tracking that on-the-ground growth and development is a tricky task. When the Washington Post wanted to look at Houston's impervious surface cover and its recent spread, it had to rely on data that was several years old by the time Harvey hit.
Dr. Christopher Hakkenberg, a postdoctoral researcher with Rice University's Department of Statistics as well as a scholar with the Kinder Institute, also noticed the dearth of data when it came to land cover and changing land uses over time. To track Houston's development, for example, the National Land Cover Database only releases datasets every five years.
So to create a year-by-year analysis of land cover change in the Houston metropolitan area, Hakkenberg relied on a multi-step process of machine learning image analysis to classify land cover in the 13-county Houston-Galveston Area Council (H-GAC) area from satellite imagery, using the NLCD's own classification system. Of particular interest were four categories measuring the level of development.
With satellite imagery stretching all the way back to 1997, Hakkenberg was able to chart the annual change in land cover H-GAC over 21 years, recording when and where specific land cover conversions occurred. The first thing that became apparent? Houston's relatively massive scale. "This is greater Houston and it's essentially the size of Massachusetts and Connecticut combined," he said. The second? The rapid pace of development as the area is built out.
In the 13-county area, almost 900 square miles were developed between 1997 and 2017.
Though Harris County accounted for more than 200 square miles of that growth, Montgomery County was close behind, with more than 150 square miles of new development. When looking at the percent increase in development during that period, Fort Bend and Montgomery counties were nearly even with just under an 80 percent increase in developed land cover. Waller, Liberty, Chambers and Brazoria counties also experienced more than a 60 percent increase in developed land cover.
A not insignificant amount of that development fell inside wetland and floodplain areas. Fort Bend County, in particular, almost doubled its development inside these ecologically sensitive areas between 1997 and 2017. Because floodplains can change over time, it's possible some of that development occurred outside of the FEMA 100-year floodplain but was later recategorized when the floodplain was redrawn.
Liberty County had the next largest increase in development inside the floodplain, with just under an increase just under 70 percent. Montgomery, Harris and Chambers counties also had significant increases in development inside the floodplain.
Because of the classification system, Hakkenberg was also able to see what land uses were lost when new developments came in. "By and large, pasture and grassland were converted to developed [areas], but we do see substantial changes for wetlands," he said.
Hakkenberg plans to make the data available via the Kinder Institute's Urban Data Platform for researchers interested in flood policy, environmental, health or other analyses. For more information, head here.

