Earlier this month, the director of the Census Bureau announced all counting efforts for the 2020 census — including self-reporting online, by phone and mail, as well as efforts by enumerators to gather responses in-person — would end on Sept. 30 — a month sooner than what was previously announced.
That leaves just a little more than a month and a half to try and account for the 37% of U.S. households that haven’t yet responded. In Texas, 41.5% of households have yet to be counted. Harris County’s self-response rate is 58.1%, roughly the same as that of the state as a whole, while the rate in Houston is lower at 54.3%.
Since early May — about three and a half months ago — the self-response rate in Houston has increased only 7%. That increase parallels those for the county, state and nation, which means the Census Bureau workers currently out knocking on doors to improve those rates and get a more accurate count of the population, now find themselves up against a new, earlier deadline, in addition to all of the risks that come with doing this work in the middle of a pandemic.
A lot at stake for Houston students
Census results determine the number of seats Texas has in the U.S. House of Representatives, as well as how congressional and state legislative districts are drawn up. For the next 10 years, an undercount of the population also would impact the distribution of around $1.5 trillion a year in federal funding to states and local governments. Many census-guided federal programs would be affected, including Medicare and Medicaid, as well as educational programs such as Head Start, Title I, Special Education and the National School Lunch Program. Census-guided funding also supports training programs for teachers, after-school programs and improving classroom technology. Data extracted from census results are used to decide both how federal funding is divvied up and which individuals and organizations qualify to receive it through these programs.
Each year, local education agencies and schools receive census-guided federal funding, in addition to state and local revenue. When it comes to the distribution of revenue sources, the amount that Texas school districts receive from state sources is much lower than those in other states. Nationally, the average share of revenue coming from the state was 46.7% in 2018, according to public elementary-secondary education finance data from the Census Bureau. In Texas, that average was 33.7%. And only 9.5% of the Houston Independent School District’s revenue came from state sources.
That means every dollar of federal funding is important. And it further underscores the importance of full participation in the census at the local level — a lot is on the line.
Leah Binkovitz wrote about Texas’s shortcomings in both per-student spending and state funding in a 2018 Urban Edge post. At that time, the latest data available was for 2016, in which just 13.8% of HISD’s revenue came from state sources:
That reflects an ongoing issue within the state. Broad cuts in 2011 are still impacting school districts across Texas, despite rebounding state spending. A study from the Center for Public Policy Priorities and the University of Texas at Austin’s UTeach Institute found that five years after the cuts, even as education spending from the state increased, it was not evenly distributed and per student still did not match 2008 spending levels.
After legal challenges effectively resulted in a dead end for districts looking for more state support, school districts are hoping the legislature will come up with an improved funding formula.
The continued decline in the average share of revenue from the state — down 4.2% between 2016 and 2018 — seems to indicate school districts are still waiting for that improved funding formula.
State funding versus federal funding
From 2016–2018, HISD’s share of state-sourced revenues went from 13.8%, down to 8.1%, and back up to 9.5%. During that time, the district’s share of revenue from federal sources increased, from 11.9% to 12.1% to 12.9%.
By far, HISD’s largest source of revenue is local — 77.6% in 2018 — and almost all of it (94.5%) comes from property taxes.
Of the nation’s 50 largest school districts, five in Texas — Austin ($69 million), Fort Bend ($242.7 million), Katy ($252.5 million), Houston ($253.9 million) and Dallas ($258.9 million) — received the least amount of revenue from state sources. Austin ISD far and away received the smallest share of revenue from the state — just 4.5%.
Those getting the largest amount of money from the state are the New York City ($10.9 billion), Los Angeles Unified ($6.2 billion), Hawaii Public Schools ($2.9 billion), Chicago ($2.5 billion) and Clark County (Nevada) ($2.2 billion) school districts. School systems received the largest share of their revenue from state sources include 61% in LA, 62% in Clark County, and the Long Beach Unified School District’s 63%. In Hawaii, the public schools get 90% of their funding from the state.
Of the 20 largest school districts in Texas, only Houston, Dallas and Austin ISDs received more federal than state funding. In 2018, Texas received $6.3 billion in federally sourced revenue for public elementary and secondary school systems, $20.9 billion in revenue from state sources and $34.7 billion in revenue from local sources — $31.6 billion of which came from local property taxes.
California, Texas, Florida, New York and Illinois are the five states whose school systems receive the most federal funding overall. Except for Florida, total state funding for school systems is the highest in those same states.
Per-student spending remains low in Texas
Texas’s school districts spend less per student than the national average, which was $12,612 per pupil in 2018 — an increase of 3.4% from 2017, according to the Census Bureau data. The average in Texas was $9,606. On average, the 10 states spent less in 2018 than Texas: Arizona, Florida, Idaho, Mississippi, Nevada, New Mexico, North Carolina, Oklahoma, Tennessee and Utah.
Back in 2016, when school districts in Texas also spent less per student than the national average, several of the state’s largest districts did see annual increases higher than the national rate of 3.2%. Houston ISD’s $9,633 per student was a 15% increase from what it spent in 2015. Arlington, Aldine, Dallas and El Paso school districts also saw annual increases above the national rate that year. HISD’s per-student spending rose again in 2017, this time to $9,716; however, it declined 2% in 2018, to $9,505.
More resources are needed
Students from low-income households often require additional resources to meet their academic and non-academic needs. Federal programs like Title I provide funds to states and school districts to help close the gaps disadvantaged students face, but the funding is low. Ruth N. López Turley, director of the Houston Education Research Consortium, wrote in June about the need to increase per-pupil spending for low-income students in Texas. Research shows the state falls far short of adequate funding for these students, and HISD spends less than half of what would be needed to achieve national-average outcomes.
Students who already were at a disadvantage before the coronavirus pandemic could very well see those gaps widen with extended time away from school in the spring and classes beginning online in the fall. As Turley pointed out, to improve equity, increasing per-pupil spending for students in need is even more important now.
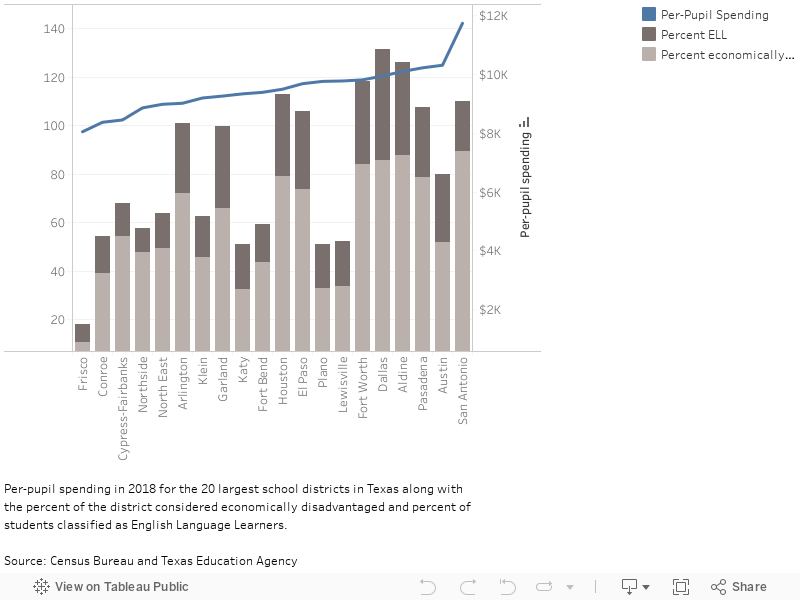
The data in the chart below is for the 20 largest school districts in Texas, including 2018 per-student spending and two key measures of student need — the percent of the district considered economically disadvantaged and percent of students classified as English Language Learners.