For many cities rising rents and growing commutes seem to go hand in hand. New estimates from the Census Bureau’s American Community Survey released today reveal the extent of those changes nationally.
Among the 50 most populous cities, 32 had increases in monthly median rent and nine had no change between 2007 and 2016. Los Angeles couldn't been included in the analysis because its metropolitan area boundaries changed during that period but it's seen increases as well.
As a whole, the country’s median monthly rent increased $21 to $949. In Harris County, the climb was steeper. Median rent in 2009 was $795, so adjusted for inflation from December 2009 to December 2016, that would be $888.81. Instead, the median rent in 2016 was $937, according to the latest estimates, a roughly $48 dollar increase, more than twice the national increase over an even shorter amount of time.

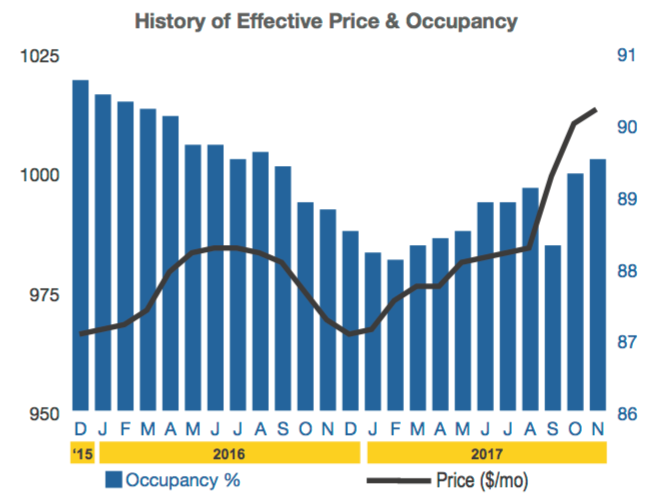
Houston area effective rental prices.
Source: ApartmentData.
Those increases only went higher in the Houston area following Harvey, according to ApartmentData.com, a Houston-based real estate firm. Using survey data, the firm documented an increase in effective rental prices, which factor in any concessions or utility adjustments offered, following August when Harvey hit.
As of November, the average effective rental price in the Houston area was around $1,013 per month, according to ApartmentData.com.
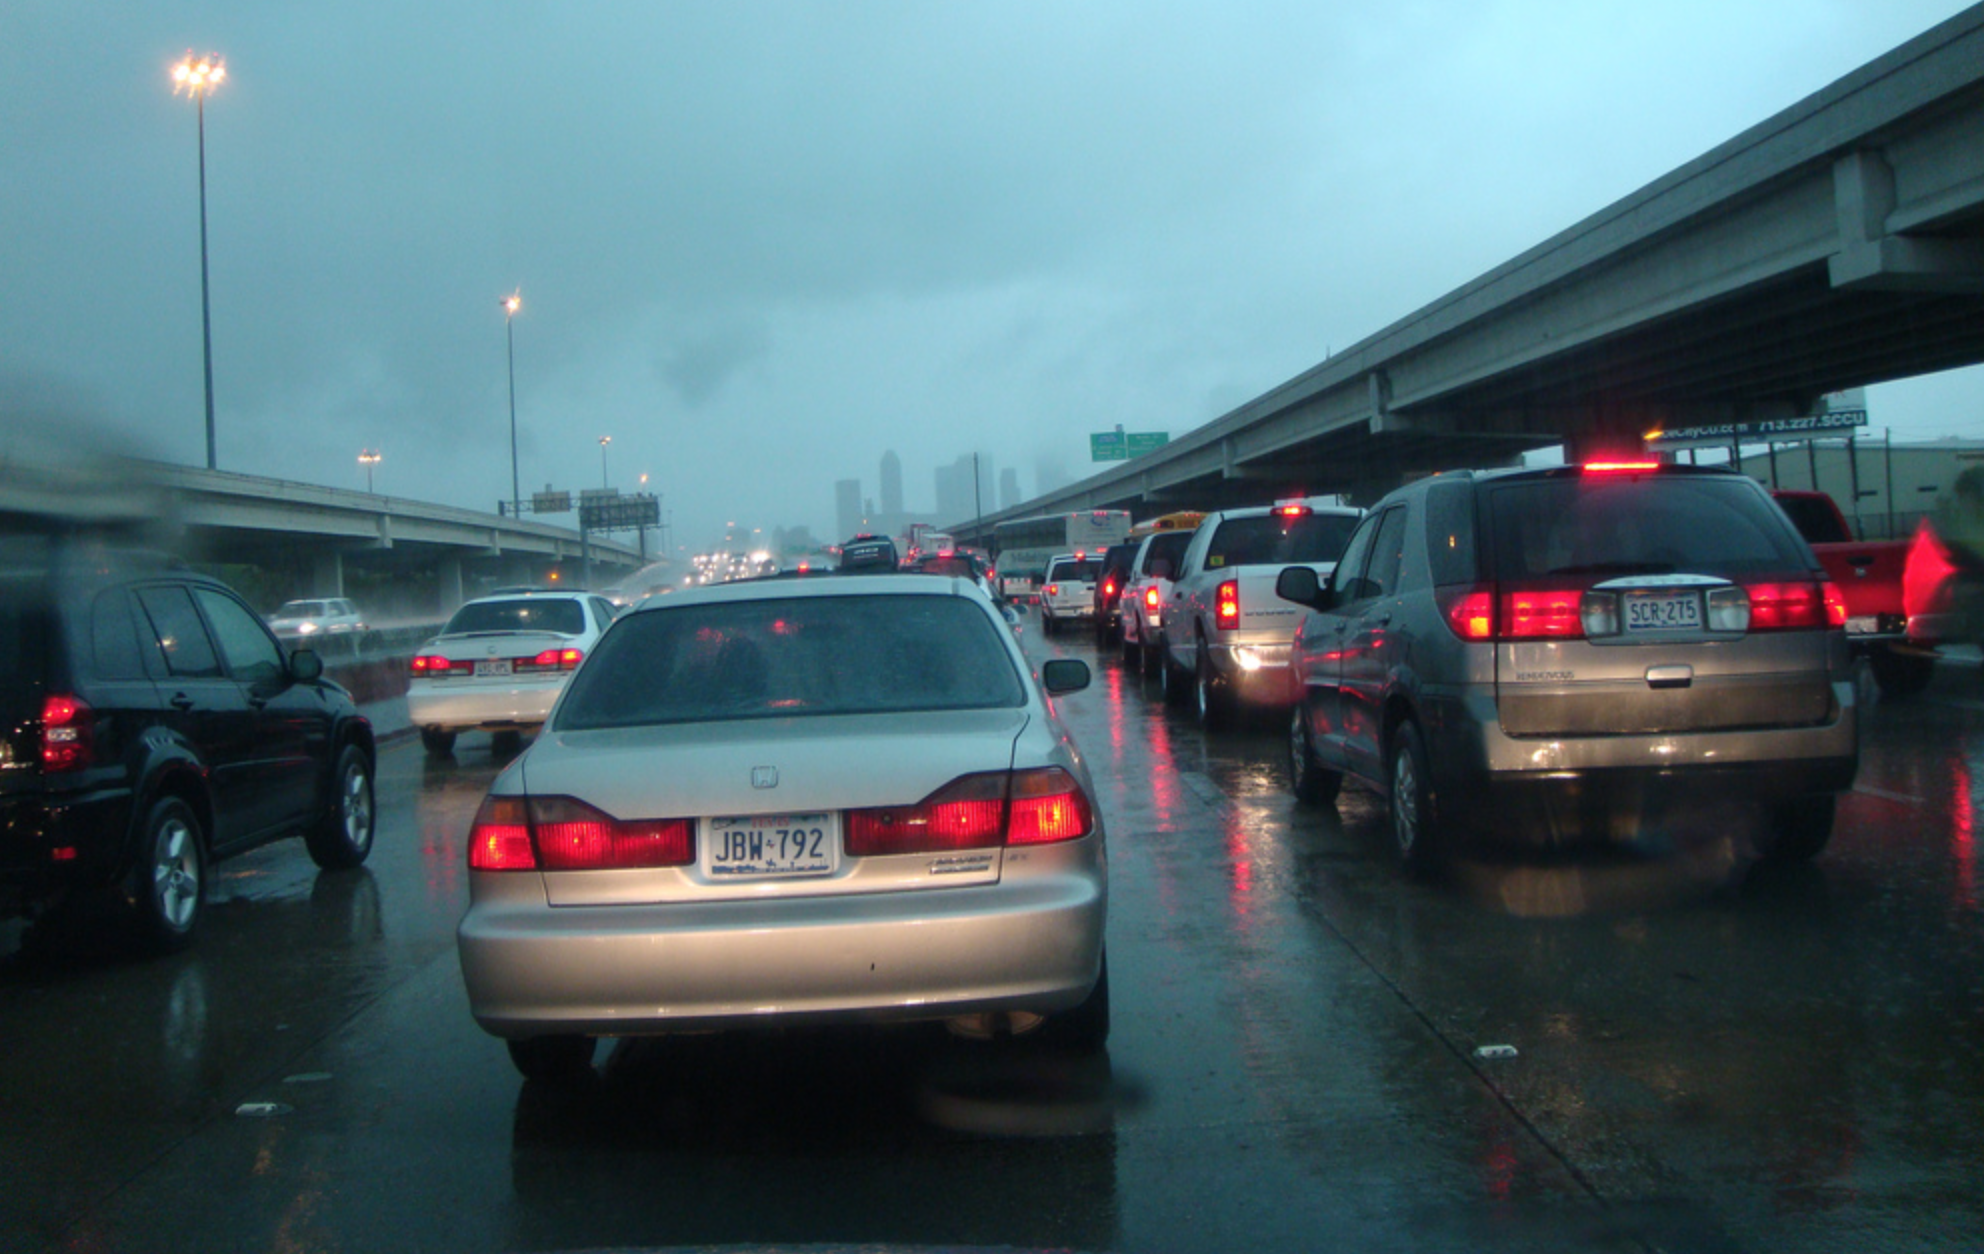
Perhaps relatedly, commute times are growing across the country as well. That’s likely not a surprise to many in the Houston area where roughly 10 percent of drivers have at least an hour-long commute. But how does Houston compare? While New York and D.C. claimed many of the top spots nationally – with the top honor going to Pennsylvania’s East Stroudsburg and its 38.6-minute average commute – the Houston metropolitan area was not far behind with an average commute of roughly 29.5 minutes. That's up from 28.2 minutes in 2013.
Among metropolitan areas including San Juan, Puerto Rico, Houston ranked 20th for longest average commute time. Boston, Chicago and several California cities also ranked high. Among Sun Belt cities, Houston's commute time was roughly on par with that of the Los Angeles metropolitan area (29.6 minutes) and Miami (28.5 minutes) but shorter than that of Atlanta (31 minutes).
Most of the commuters were driving to work alone. Only 2.3 percent of commuters in the Houston metropolitan area took public transportation to work, compared to 6.0 percent in Los Angeles, 3.7 percent in Miami and 3.1 percent in Atlanta. That number was pretty much flat since 2013 for Houston.
In Harris County, the percentage of people commuting via public transportation actually appeared to drop between 2009 and 2016, from 3.4 percent to 2.8 percent. In neighboring Fort Bend and Montgomery counties that percentage has stayed more or less flat in recently years at 1.7 percent for Fort Bend County and 1.3 percent for Montgomery County.
In Harris County, 79 percent of commuters drove alone while 11 percent carpooled. An additional 1.5 percent walked to work and 0.4 percent biked to work. And 3.5 percent worked from home.
Commutes on public transportation tended to be longer than by car. The mean travel time for transit commuters was 50 minutes compared to 30.1 minutes for individuals who drove alone to work. In fact, most public transit commuters had commutes longer than 45 minutes, roughly 57 percent, while 40 percent had commutes over an hour.
The numbers also illustrate the range of folks who take public transportation and it isn’t just people without a car. About a quarter of transit commuters said they had no vehicle available but 16 percent said they had three or more available. Riders also had a range of incomes. Almost a fifth of transit commuters had incomes above $75,000, according to the estimates. That’s compared to 13.6 percent of carpoolers and 23.5 percent of solo drivers. Meanwhile roughly half of transit commuters and half of carpoolers earned less than $25,000 while just 30.5 percent of solo drivers did.

