

There’s been a lot of publicity lately about the fact that in the last couple of years, Harris County has not been the population growth machine it’s been in the past – while nationwide the suburbs are now growing faster than core urban areas.
As we reported not long ago, the most recent Census estimates show that metro Houston fell far behind metro Dallas in population growth last year, after several years in the No. 1 spot. Meanwhile, the Census found that last year Harris County fell far behind Maricopa County, Arizona, which is now the No. 1 county in the nation for population growth. And recently the respected demographer William Frey of the Brookings Institution found that population growth in core urban areas like Harris County has now fallen behind growth rates in the suburbs, the exurbs, and rural areas.
Further analysis by the Kinder Institute finds that underlying all three of these trends are two striking facts: First, the decline in population growth in metropolitan Houston is all occurring in Harris County. And second, that decline in population growth is due entirely to a striking reversal in domestic in-migration in Harris County. Natural increase (births over deaths) and international migration are holding steady, but in 2017 far more people moved out of Harris County to go to other places in the United States than moved into Harris County from other places in the United States, according to the recently released Census data.
Clearly, many of these out-migrants may simply be going to the Houston suburbs. But the population dynamics in the suburbs have not changed much in the last couple of years. And the idea that Harris County is losing domestic migrants flies in the face of Houston’s own self-image. After all, the idea that you live off of natural increase and international migration – while losing your own residents to other places – is often viewed in Houston as a California kind of thing, not a Texas kind of thing.
To understand these trends a little more, we looked at population growth patterns both for 2016-2017 and for 2010-2017. And we adapted Frey’s typology of counties to suit the Houston circumstance. (I am grateful to Bill Frey for providing us with the typology he uses to categorize counties within metro areas – the basis of the blog we linked to above.)
We separated the nine counties in Houston’s metropolitan statistical area into three categories – Harris County, the core urban county; four suburban counties (Fort Bend, Montgomery, Galveston, and Brazoria); and four lightly populated exurban areas (Austin, Chambers, Liberty, and Waller). (Frey breaks suburban counties down into more categories, but in this analysis we found little difference between those categories so we lumped all the suburban counties together.)
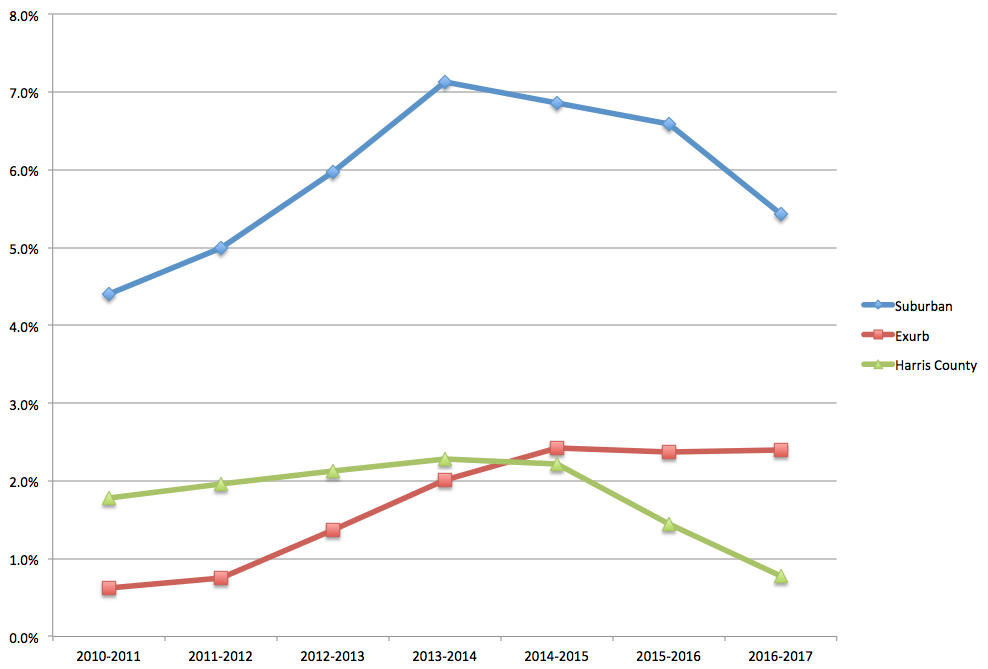
Rate of Population Growth, 2010-2017.
Here’s what we found:
First, as the figure above shows, the rate of population growth over the past seven years has been extremely different in these three different types of counties. Suburban counties have been growing fast – 5 percent to 7 percent per year. Both exurban counties and Harris County have been growing much more slowly. But during this time, the exurbs’ growth rate picked up, while Harris County’s slowed down.
The next chart, below, shows an even more striking trend: In the last two years, the four suburban counties have exceeded Harris County’s raw population growth. A few years ago, Harris County was adding almost 100,000 people per year while the four suburban counties were adding around 60,000. Last year, the suburban growth slowed somewhat, to around 53,000. But it was still way more than Harris County’s growth, which dropped to only 35,000 – a third of what it had been only two years before.
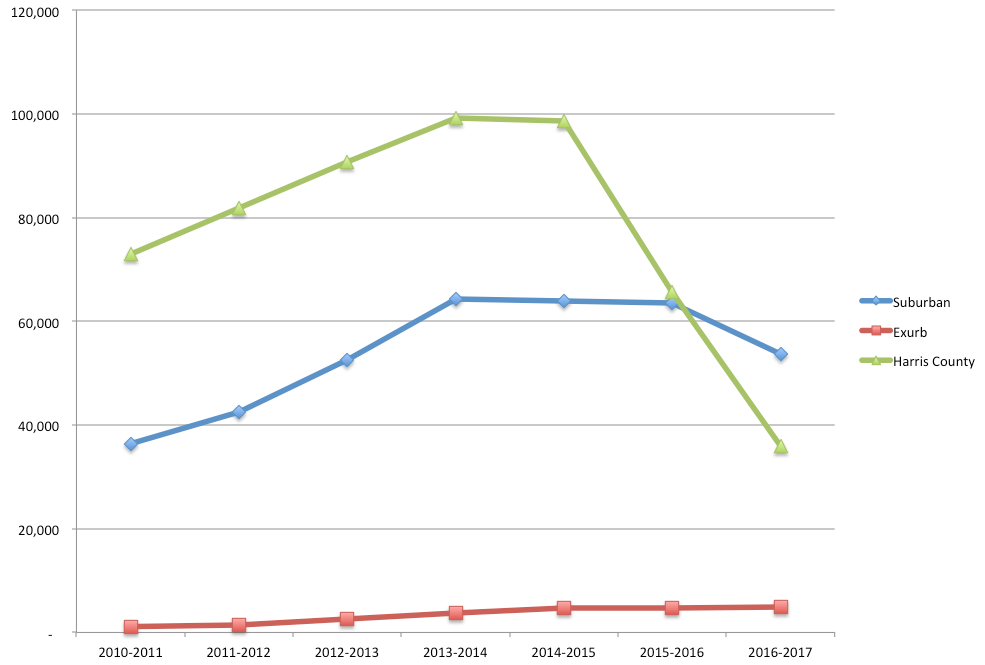
Rate of Population Growth by Year, 2010-2017.
Furthermore, the components of the population growth in Harris County, the suburbs, and exurbs were very different between 2010 and 2017. For the metropolitan area as a whole, 45 percent of the population growth came from natural increase, while about 27-28 percent each came from international immigration and net domestic migration. But different parts of the metro area saw very different patterns. Harris County has very little domestic net-migration during this period; virtually all of the county’s population growth came from natural increase and international immigration. But both in the suburban and exurban counties, most population growth came from domestic in-migration. Presumably, a lot of people moved from Harris County out. But some evidence suggests that more people are moving straight to the outlying counties from other parts of the U.S. – a change from the past.
If we unpack these statistics a little more, a really striking trend appears. In the last two years, domestic in-migration in Harris County has flipped upside down – but has remained more or less the same in the suburban counties.
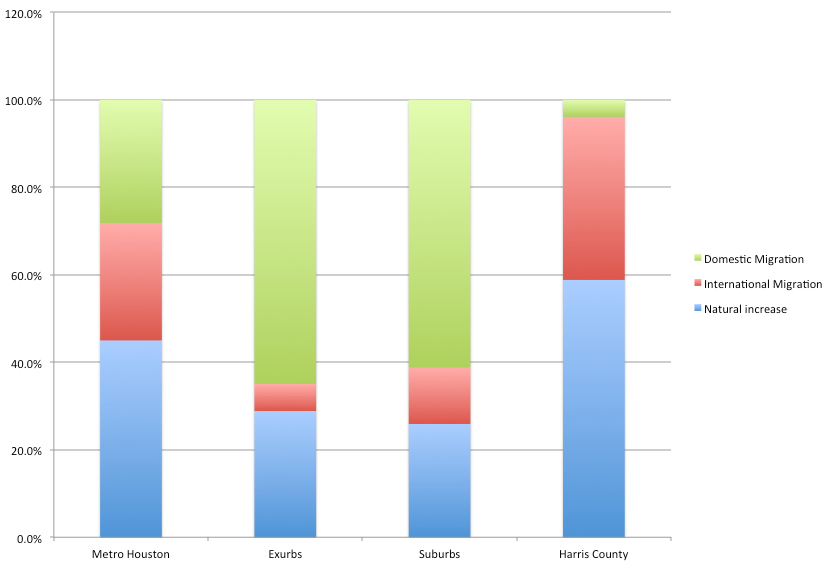
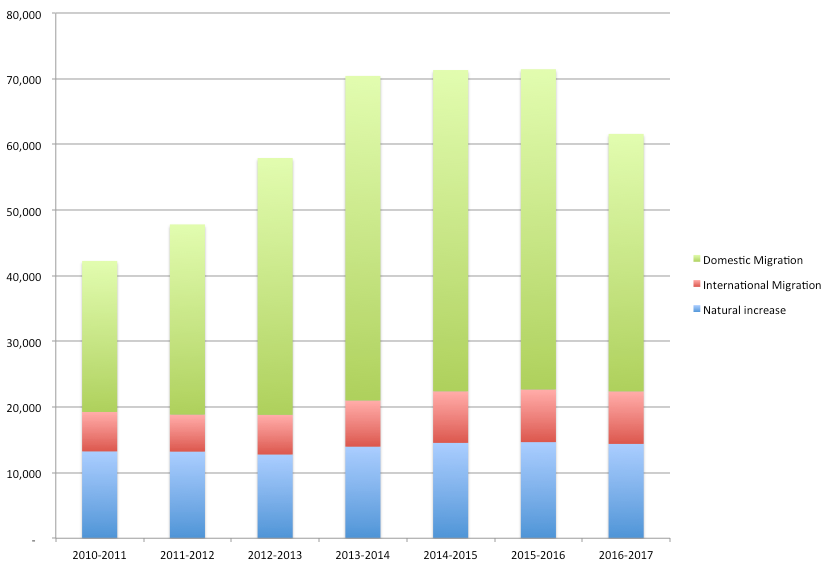
Components of Population Growth, 2010-2017.
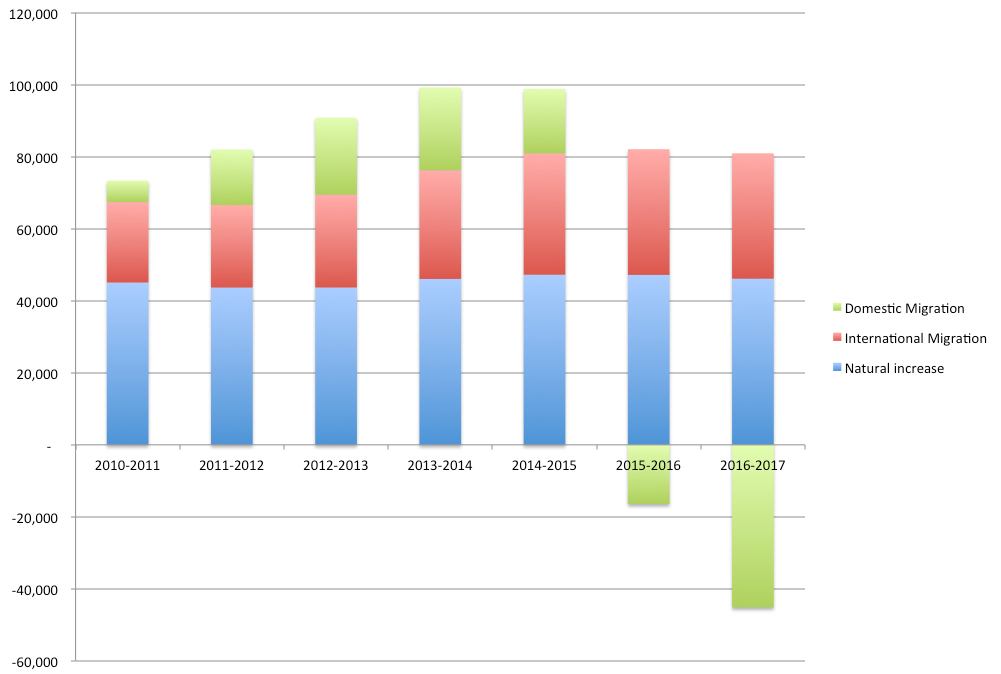
Components of Population Growth by Year, Harris County, 2010-2017.
The charts above show the components of population growth in the different county types as well as that breakdown by year in Harris County since 2010. You’ll see that natural increase (about 45,000 per year) and international migration (about 33,000 per year) have been remarkably stable in Harris County. But domestic in-migration dropped from a 17,000 net inflow two years ago to a 45,000 net outflow last year. That’s a lot of pickup trucks and U-Haul vans pointed outward.
This is a pretty significant contrast to the suburban counties. As the chart below shows, the four suburban counties, like Harris County, have had very consistent natural increase and international immigration. Domestic in-migration dropped only modestly last year but remains strongly on the plus side.
Components of Population Growth by Year, Four Suburban Counties, 2010-2017.
It’s too soon to tell whether the big drop in Harris County’s domestic in-migration will bounce back. These estimates only run through last July 1, so they don’t pick up any Hurricane Harvey exodus. But one thing is already clear: As with many core urban areas, Harris County’s glory days as a magnet for migrants from other parts of the United States are over. Even before the drop, most people arriving in Houston were not arriving in pickup trucks on I-10 or I-45, but rather from overseas or at hospital delivery rooms.