After all, Americans had been doing just the opposite for decades. By 2004, the average American drove 10,000 miles each year, up from just 5,400 miles annually in 1970.
But from 2004 to 2014, the trend reversed. Americans drove less in each year than they had the year before. The average miles traveled over the course of the year fell nearly 1 percent each year over the 10-year period.
But during that same period, the federal government steadily increased the amount of money it spent each year on highway expansion projects – though there was a brief dip in annual expenditures during the recession.
Despite the growth, the taxes and fees meant to cover highway expenses – gasoline taxes, truck-related excise taxes and highway user fees – didn’t keep pace. The federal gasoline tax, for example, isn’t indexed to inflation and has remained at 18.4 cents per gallon since 1993.
As a result, the country now dips into its general fund to cover its long-term highway expenditures. And the gap between highway-related revenues and highway spending is only expected to grow, according to Congressional Budget Office projections.
Those are insights from a report released this month prepared by nonprofit advocacy groups the U.S. PIRG Education Fund and Frontier Group that addresses “Highway Boondoggles.” It lists what the groups believe are the most misguided highway projects in the country.
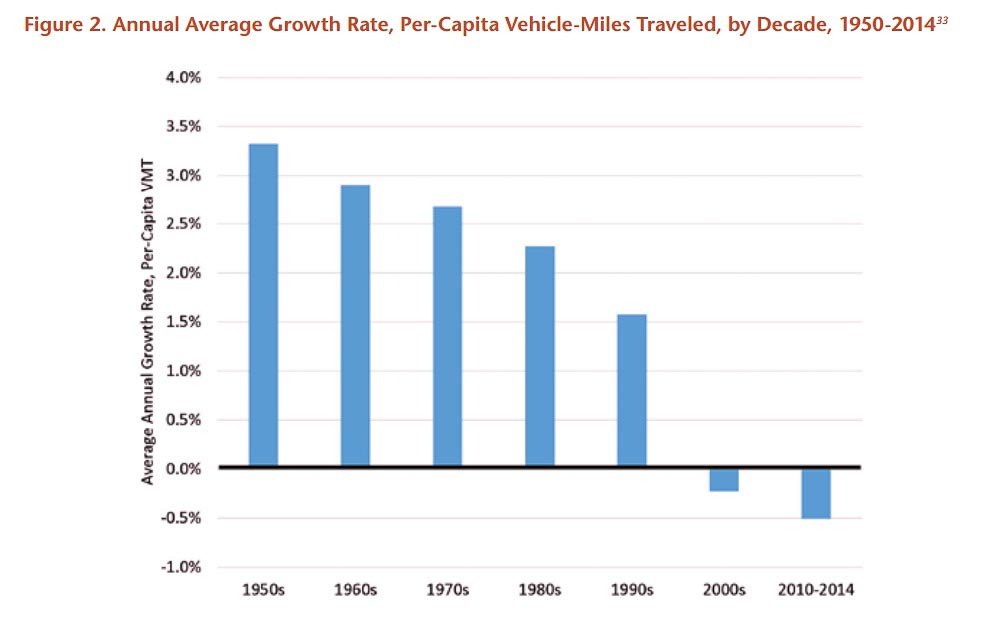
Here are two graphs the authors use to demonstrate the drastic changes in U.S. driving behavior and the federal government’s non-reaction to it.
This first graph shows the average growth from one year to the next in total miles traveled per person in the U.S., broken down by decade. Though the per-capita growth turns negative for the first time in the 2000s, you can see that the rate of increase in driving had been trending downward each decade since the 1950s, when economic growth in the U.S. helped expand the middle class, homeownership, suburbanization, and vehicle ownership.
“Driving declined for a variety of reasons,” the report reads. “While the economic recession contributed to the fall in driving, the downturn began in 2004, years before the economic decline. The rate of growth in driving has been declining since the 1950s, in terms of both overall vehicle-miles traveled and per-capita driving.”
By 2014, the most recent year with available data, Americans drove, on average, as much as they had in 1997, according to the report.
Still, it’s worth nothing: for decades, total miles driven – in other words, not on a per capita basis – have been steadily increasing. They ticked upwards last year after being relatively stagnant in the post-recession years from 2008 to 2013.
But the groups argue that highway expansions are usually justified by projected future vehicle miles traveled. While total VMT has increased over the years, it hasn't come close to the federal government's projections.
"In 1999, the federal government anticipated that Americans would be driving 3.7 trillion miles per year by 2013 – 26 percent more miles than we actually did,” the report reads. "The U.S. Department of Transportation now forecasts that we will not attain those vehicle-miles traveled (VMT) levels until 2037.”
The report credits a number of factors for the decline. For one, the number of Americans with licenses had been steadily increasing during the same period, though that number peaked in 2000, as did the number of cars per household. Plus, the “Driving Boom” tracked along with the period that Baby Boomers were part of the working population; driving has subsided as they’ve left the workforce.
It also points to increased interest in urban living, increased use of transit and decreased interest in driving among young people.
But none of that has done much to discourage investment in highway projects. Neither the stagnation of revenues used to pay for highway projects.
The federal highway trust fund has spent more than it’s collected each year since 2001, and the gap is expected to widen through 2025, the report concludes, based on CBO projections.
That’s meant filling in the gap with general fund revenues.
“Bailing out the Highway Trust Fund with general funds cost $65 billion between 2008 and 2014, including $22 billion in 2014 alone,” the report reads. “Making up the projected shortfall through 2025 would cost an additional $147 billion.”
(The CBO, meanwhile, has a more conservative estimate, putting the cost of the projected shortfall through 2025 at $108 billion in a report this month).
Unsurprisingly, the specific highway projects the report questions include a handful from the famously car-loving Sun Belt. They include a $3.3 billion project to put congestion-bypassing toll lanes on three highways in Tampa; a $109 million, four-mile toll lane project on Austin’s Highway 45 Southwest; a $3.2 billion to $5.6 billion tunnel project in Los Angeles’ San Gabriel Valley on I-710; a $647 million express lane project on Charlotte’s I-77; Houston’s own expansion of State Highway 249 for up to $389 million; and a $96 million highway extension in New Mexico.


