The “breakneck momentum” of single-family home sales in the Houston area continued in January, jumping 27.7% compared to the first month of 2020. Demand is high, supply is short and interest rates are at historic lows, all of which helped push the median price of a single-family home in the area to $263,500 — a record for January. That price is 12.1% higher than this time last year, according to the latest report from the Houston Association of Realtors.
Chance Brown, broker/owner with CB&A Realtors, called the demand “unreal” and compared the extremely low housing inventory to the toilet paper shortage seen early in the pandemic.
“I think COVID made people want to have a place of their own,” Brown told the Houston Chronicle.
Unfortunately, not all Houston-area residents are able to take advantage of the historically low interest rates and buy a home of their own. And because of the blow that’s been dealt to the economic well-being of many by the pandemic, a lot of residents who own a home aren’t sure how long they can afford to keep them.
According to the latest Household Pulse Survey from the Census Bureau, 41% of Houston-area homeowners reported being likely to face foreclosure in the next two months. For close to 62% of Black homeowners and 84% of Asian homeowners, foreclosure is either “very” or “somewhat likely.” That’s compared to 27% of white homeowners and just 8% of Hispanic homeowners who responded to the survey between Jan. 20–Feb. 1.
During that period, more than 55% of Houston-metro households reported being behind on rent or mortgage payments and likely to be evicted or foreclosed on in the next two months. It was the largest percentage among the nation’s 15 biggest metros and the highest share recorded for the area since data on a range of ways in which the pandemic has impacted people’s lives began being collected last April for the biweekly report.
The widening wealth gap
The data show that economic well-being is the rising tide that lifts all boats and keeps them afloat for generations. That’s because in this country, without wealth and assets, there’s no access to education, no health insurance (in states like Texas) and no child care, to name just a few barriers. And without those things, there’s little chance of ever being able to accumulate wealth.
Census data from 2019 shows that the median income for Black households is 33% lower than the national median income and the Black homeownership rate is 22% lower than the overall homeownership rate in the U.S.
A SmartAsset analysis of cities where Black Americans fare best economically found six of the top 10 cities are located in Florida, North Carolina and Texas, including the Dallas suburbs of Garland (No. 7) and Grand Prairie (tied for No. 1). In both of those cities, the study shows, the median Black household income is above $61,000 and the Black homeownership rate is 46% or higher. Study-wide, the average median income was $43,000 and the homeownership rate was 35%.
The wealth inequality in America simultaneously is caused and perpetuated by low homeownership rates among minority households. And that inequality has grown worse during the past 20 years or more.
Since 2000, not much ground has been gained in improving the economic health of the nation’s most vulnerable communities. From the rates of homeownership and unemployment to median household income and net wealth, instead of shrinking, the gaps are widening. And that was before COVID-19, which has only worsened many of these disparities, the latest being life expectancy, which had been improving before the pandemic. In the first half of 2020, U.S. life expectancy dropped by a full year across the board, but for African Americans, it fell by 2.7 years.
Before the pandemic, many Americans — Black Americans, in particular — were still struggling to recover from the Great Recession, which hit them hardest financially. It’s not unlike what was seen in many homes across the Houston area during last week’s brutal winter storm as residents still living in homes damaged by Hurricane Harvey were left even more vulnerable to the freezing temperatures that in turn caused more damage.
The link between homeownership and wealth
When it comes to wealth, home equity and retirement accounts constitute close to two-thirds of American households’ net worth.
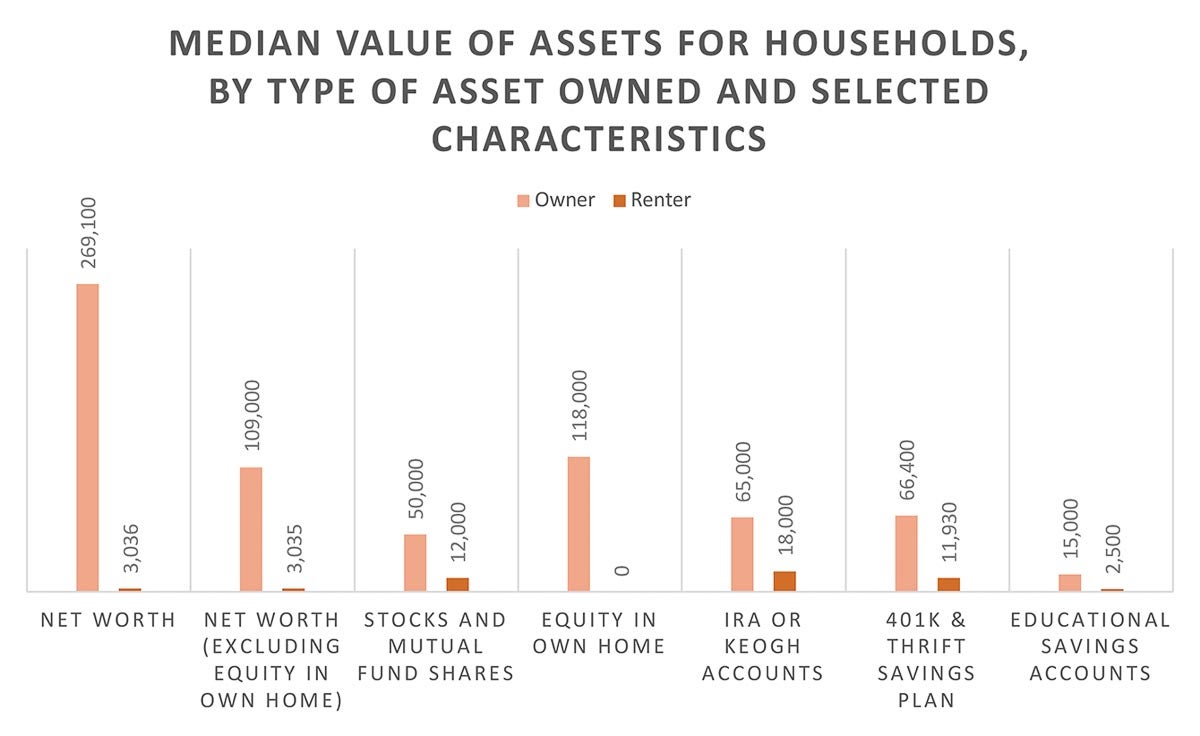
A Census Bureau report on household wealth released last August showed the median net wealth of homeowners was almost 87 times greater than renters’ median net wealth. That was up from a similar analysis in 2019 that found the median net worth of homeowners to be 80 times that of the median household that rented. And even when home equity was excluded from total wealth, the average net worth of households that owned their homes was still 36 times larger than renters.

Data source: U.S. Census Bureau, Survey of Income and Program Participation, Survey Year 2018
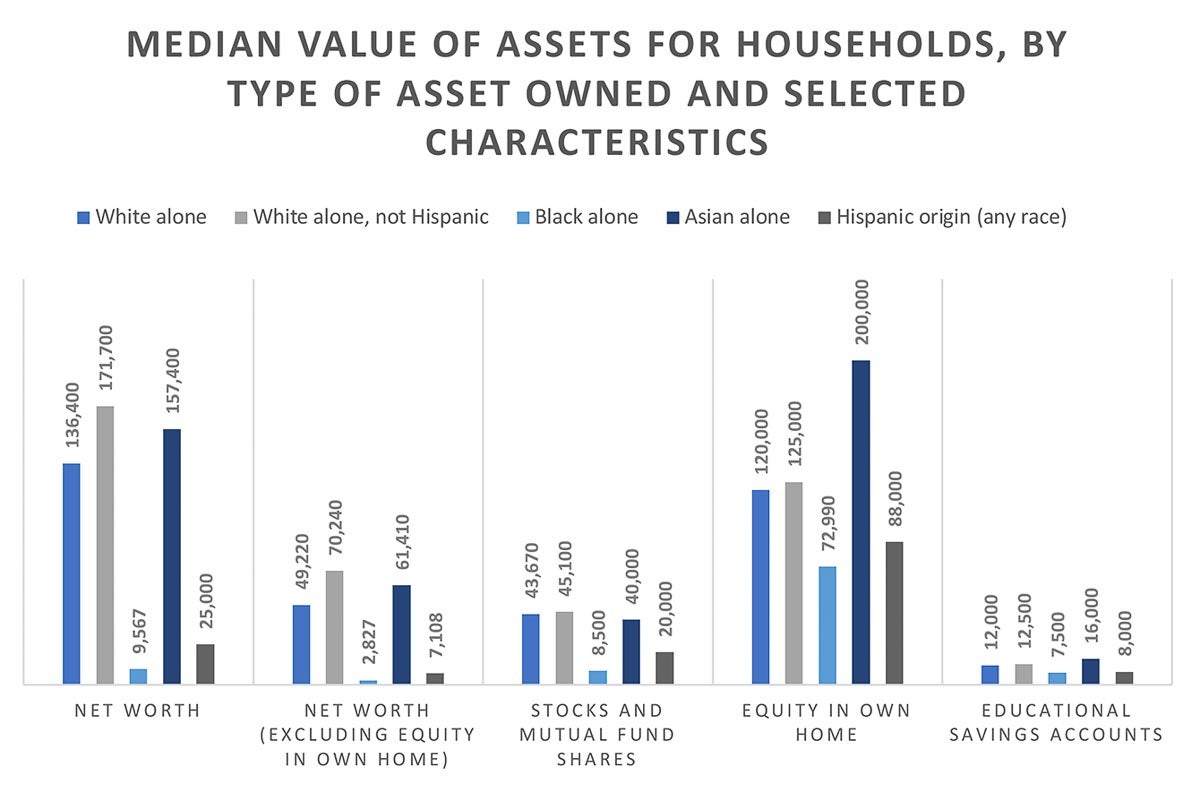
According to the Federal Reserve’s 2019 Survey of Consumer Finances, Black families’ net worth is 87% lower than that of white families — $24,100 compared to $188,200 — and 33% lower than Hispanic families — $24,100 versus $36,100. That survey also shows Black households in the U.S. are less likely to have a retirement account than white households: 65% of white middle-aged families have at least one retirement account, compared to just 44% of Black families in that age group.

Data source: U.S. Census Bureau, Survey of Income and Program Participation, Survey Year 2018
Cities with the highest and lowest minority homeownership rates
Researchers with Construction Coverage, a company that provides reviews of industry software, insurance and financial products, analyzed housing data from the Census Bureau to rank U.S. cities and states according to their minority homeownership rates. The analysis includes homeownership rates for Black; Hispanic; Asian, Native Hawaiian and Pacific Islander households, as well as each cities’ share of minority population.
Only cities with populations of at least 100,000 were included in the analysis, and they were grouped into three categories — small, midsize and large — based on population size: small cities: 100,000–149,999; midsize cities: 150,000–349,999; and large cities: 350,000 or more.
Among all cities (321 total), four of the top five in the U.S. in terms of minority homeownership rates are in Texas, and three of those are in the Houston area, including the city ranked No. 1: Sugar Land. Pearland was second and League City was No. 4. Allen, north of Dallas, ranked third.

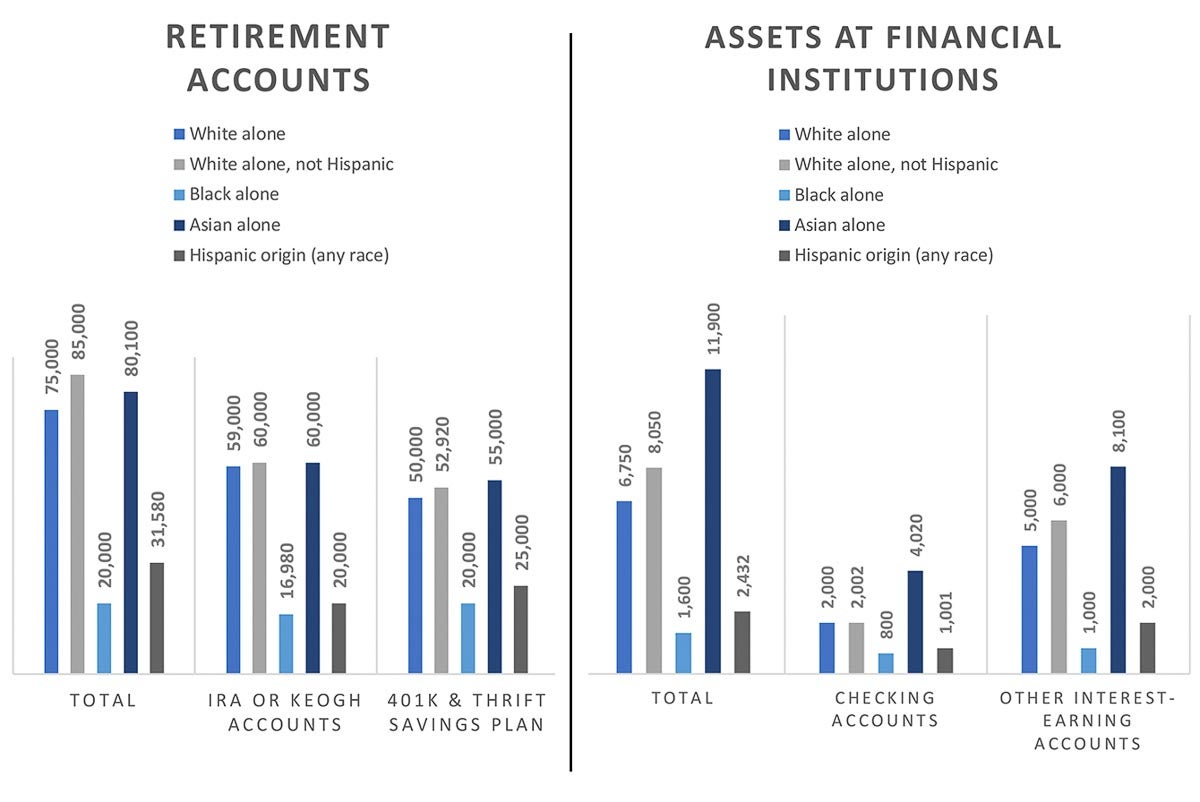
These two charts show the median value of retirement accounts and assets at financial institutions for American households.
Data source: U.S. Census Bureau, Survey of Income and Program Participation, Survey Year 2018
Sugar Land, whose population is 61.3% minority, has a minority homeownership rate of 82.5%. That’s almost nine percentage points higher than No. 2 Pearland, where minorities make up 61% of residents and the homeownership rate is 73.8%. The rate is 72.8% in League City, which has a much smaller minority population share — just 36.5%. Compare that to the cities at the other end of the rankings, including Fargo, North Dakota; Elizabeth, New Jersey; Arden-Arcade, California; and Cambridge, Massachusetts, which have minority homeownership rates of 14.7%, 19.1%, 19.7% and 21%, respectively.
Sugar Land also has the nation’s highest rate of homeownership among Black families, at 78.3%. In Pearland, the Asian homeownership rate is 90.7%, which tops the list for that category. And the No. 1 city for Hispanic homeownership rate is League City, where 80% of families are homeowners.
The city with the highest share of minority population is Miami Gardens, Florida, where 97.4% of residents are minorities. Billings, Montana, and Springfield, Missouri, tied for the cities with the smallest minority population share, both with 14.5%.
Along with being last overall, Fargo also has the lowest rate of homeownership for Black households — just 4.1% compared to 21.4% for Hispanics, 24.2% for Asians and 48.4% for white households. The city with the lowest Hispanic homeownership rate is Manchester, New Hampshire’s 12.5%, while the lowest rate for Asian households is Hartford, Connecticut’s 5.9%. The lowest rate for white households was in Newark: 29.5%.
According to the analysis:
The Southwest and California are home to most of the large cities with the highest minority homeownership rates. These cities tend to have high shares of minority population and the gap between minority homeownership and white homeownership is much smaller than the national average. The small and midsize cities with the highest minority homeownership rates are also predominantly located in the Southwest and California, but their minority homeownership rates tend to be even higher, with rates in some cities as high as 70 or 80%.
Among states, New Mexico and Hawaii, both of which have majority-minority populations, have the highest minority homeownership rates at 63.7% and 59.7%, respectively. Though they have small minority populations, Wyoming and Idaho ranked well, as did Maryland. States across the Sun Belt also ranked high on the list, with Mississippi, Texas, South Carolina and Arizona making the top 10.
At 31.6%, North Dakota has the nation’s lowest minority homeownership rate. It’s followed closely by New York where just 33.1% of minorities own their homes. North Dakota also has the country’s lowest homeownership rate for African Americans — just 7.8% — and Asian, Native Hawaiian and Pacific Islander households (30.7%). New York has the lowest rate for Hispanics at 25.7%. The homeownership rate for Black households in Mississippi is 53.5%, the highest in the U.S. For Hispanics, the highest rate is New Mexico’s 65.5%. And in Maryland, 69.9% of Asian, Native Hawaiian and Pacific Islander households own their homes.
In Texas, which ranked No. 7 overall, the minority population share is 58.9% and the minority homeownership rate is 53.5%. The rate for Black Texans is 40.7%, compared to 57.3% for Hispanics, 62.6% for Asians and 70.5% for whites.
Houston is No. 39 out of the 55 large cities in the analysis, and No. 228 overall. Though its population is 76.7% minority, the city has a minority homeownership rate of just 35.8%. In the majority-minority city, the homeownership rate for African Americans is 29.4%; for Hispanics, it’s 38.4%; and 44.4% for Asians. Those rates contrast with the 56.3% homeownership rate for white households. Other large cities in Texas have more encouraging homeownership rates for minorities, including El Paso’s 58.8% (No. 1 overall among large cities), Fort Worth’s 51.2% (No. 5) and San Antonio’s 50.8% (No. 6).
The two other Houston-area cities included in the study were The Woodlands and Pasadena, which ranked No. 32 and No. 104 overall. The minority homeownership rate in The Woodlands is 60.1%. In Pasadena, it’s 48%; however, the homeownership rate for African Americans in the city is just 15%.

