
Not long ago, CapRelo, a relocation company, named the 10 fastest-growing “exurban” counties in the United States. Only one — Williamson County — was in Texas. Located just north of Austin and home to Georgetown and Round Rock, Williamson isn’t exactly “exurban,” of course; like many Texas counties, it straddles the suburbs and the exurbs. But it is growing fast: The population has increased by 320% since 1990, ranking third on the CapRelo list.
To compile the fast-growing exurbs rankings, CapRelo created a list of 319 suburban/exurban counties nationwide and tracked their growth using census data from the 1990 Census to the 2019 American Community Survey. Thirty-one of these counties were in Texas, and although some of them grew very fast — for example, Comal County, outside San Antonio, grew by 200% — the fact of the matter is most of these counties don’t matter that much in overall population growth.
The story of suburban/exurban population growth in Texas boils down to five large and fast-growing counties: Collin and Denton, north of Dallas, Montgomery and Fort Bend, near Houston, and Williamson, north of Austin. Combined, these counties added 2.8 million people to their populations between 1990 and 2019, compared to only 1.4 million for the other 26 counties combined. And even though they are five of the largest counties in the state, they grew by 262% during this time — much faster than most of the smaller counties on the list.
Together, these five counties — with their similarities and their differences — tell a fascinating story about population growth, demographic change and political evolution in metropolitan Texas over the past 30 years.
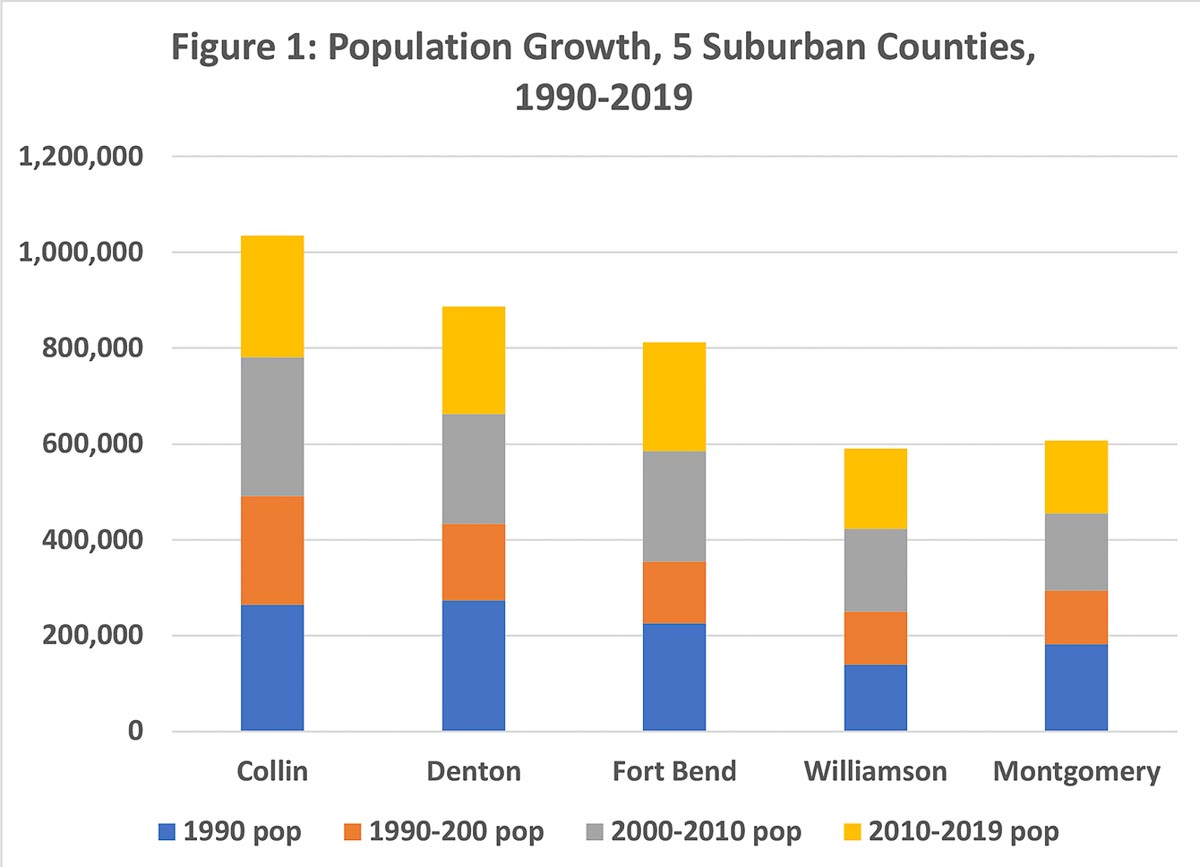
Figure 1 shows the remarkable overall population growth of these five counties during the last 30 years — including the base population in 1990 and the increase in each of the last three decades. What’s remarkable is the fact that all of these counties have, essentially, added their base 1990 population over again in each decade since 1990.
Take, for example, Collin County — the largest suburban county in the state, now with a population of over 1 million people. Home to cities like Frisco, Plano and McKinney, it’s now the sixth-largest county in the state, exceeded only by the urban counties containing the state’s five largest cities. In 1990, Collin had a population of about a quarter-million people. And it’s added about a quarter-million people in each decade since then. The other four counties have followed this same pattern.
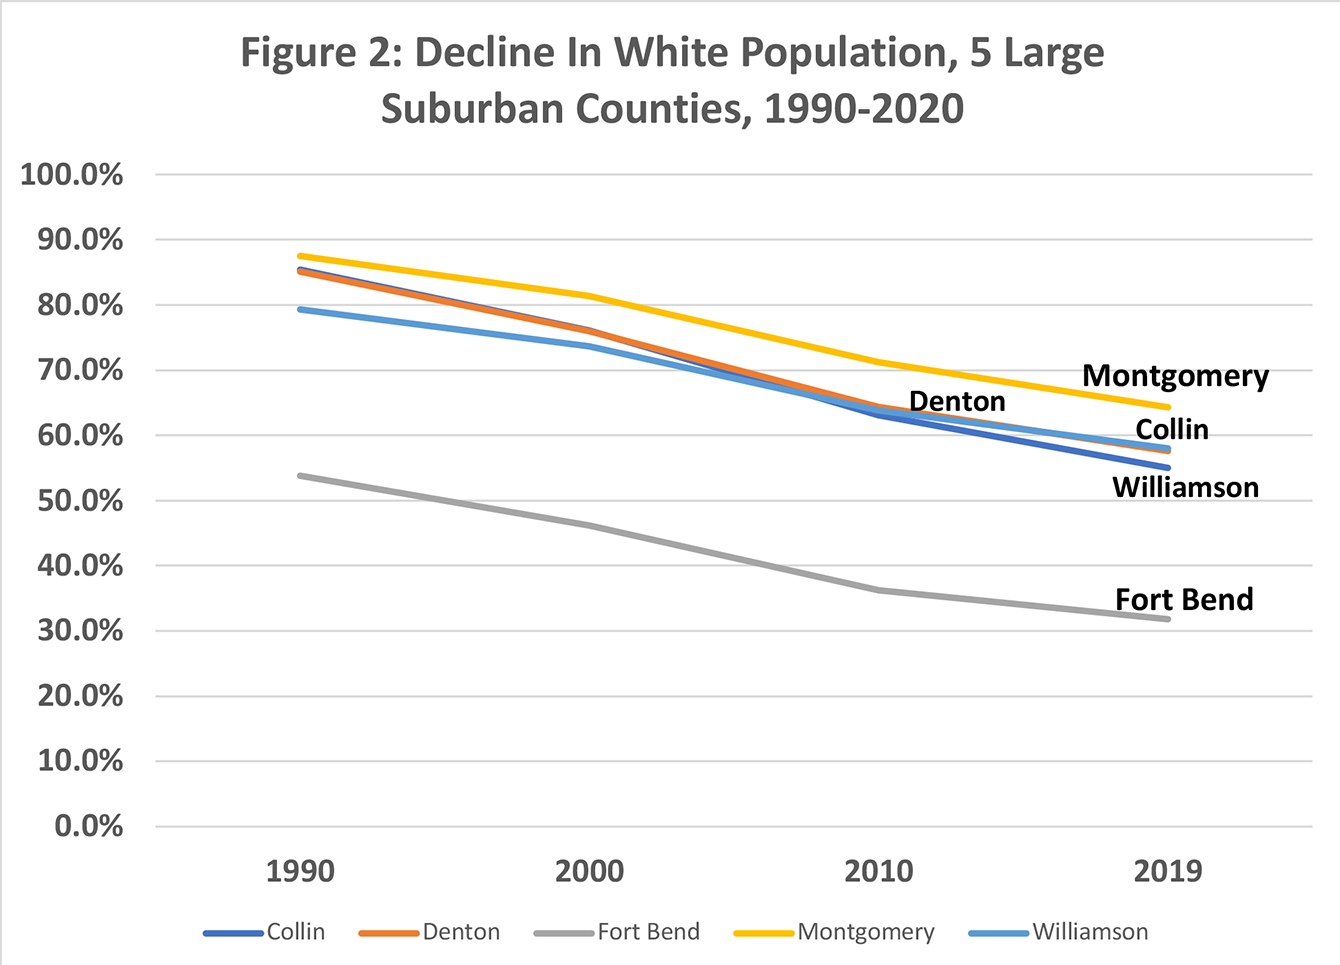
But, of course, the population hasn’t only grown during this period. It’s also changed pretty dramatically in all five counties. Maybe the easiest way to depict this is to chart the decline in the white population in each county over time — shown in Figure 2. All of the counties declined in white population by at least 17% between 1990 and 2019 — including Montgomery County, which has a reputation (deserved, as we will see) as one of the most Republican counties in the state, and perhaps the country.
Collin, Denton and Williamson all saw a drop of about 20%, from 75% to 55%. (In fact, Collin and Denton track so closely you can barely see the difference between them on the chart.) Fort Bend, often regarded as the most diverse county in the nation, dropped from 62% to 31% white during this time.
How demographic changes relate to voting patterns
So, has this change in population been reflected in voting? You don’t always see voting tracking population change, for two reasons: white people tend to vote more (or have fewer barriers to voting) and non-white populations sometimes are over-represented among children, meaning the voting-age population is lower than you might think. And, indeed we don’t see the voting follow the population change exactly.
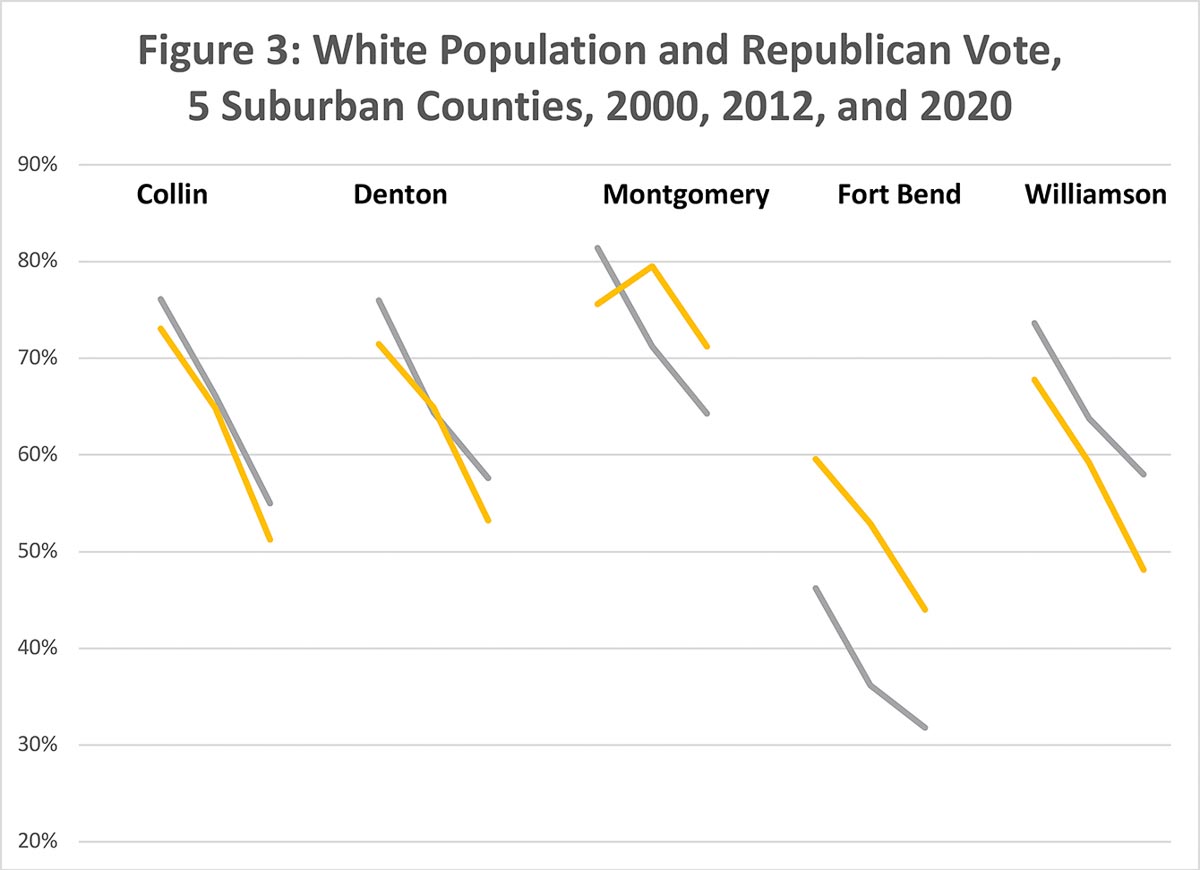
Figure 3 shows the white population and the Republican president vote totals in three presidential elections over the past 20 years that track closely with census periods. We compared the 2010 Census with the 2012 presidential election, and the 2020 presidential election with the 2019 ACS. (We threw out the 1992 presidential election because Ross Perot, a third-party candidate, got a huge percentage of the vote.) The white population is in gray; the Republican presidential vote is in orange. And here’s what we found:
► In Collin and Denton counties, the move away from the Republican presidential candidate tracked almost exactly with the decline in white population. In fact, both Collin and Denton tracked the statewide presidential vote totals almost exactly in 2020.
► In Williamson County, the voting shift away from Republican presidential candidates moved faster than the white population decline. This is not terribly surprising: Metro Austin is both less diverse and more liberal than the rest of the state.
► In Fort Bend County, the two patterns track closely — but the Republican presidential candidate typically runs around 13% higher than the white population. This suggests lower voter turnaround among non-white residents, a large group of non-citizens, or possibly both.
► And Montgomery County remains reliably Republican, despite growing diversity in its population. Even with that 17% drop in the last 30 years, Montgomery still has the largest white population of any of the five counties — 64%. Yet, Republican presidential support still reaches well into the 70s. In fact, in 2000, the white population was greater than the Republican support — perhaps because as recently as 20 years ago some Montgomery County conservatives still voted Democratic, as they had historically.
Does all of this help explain why Texas didn’t flip blue this year? Not exactly. With the exception of Montgomery County, the five largest — and fast-growing — suburban counties in Texas are moving significantly to the left. Fort Bend is demographically diverse and Williamson is, well, it’s an extension of Austin.
Maybe the counties to watch most closely are Collin and Denton, north of Dallas. They track each other — as well as statewide trends — very closely. And both the white population and the Republican presidential vote are dropping by about 10% per decade in those counties. If Texas finally flips blue, you’ll probably see it first in Denton and Collin counties.
Get Urban Edge updates
If you’re interested in stories that explore the critical challenges facing cities and urban areas — from transportation, mobility, housing and governance, to planning, public spaces, resilience and more — get the latest from the Urban Edge delivered to your inbox.