"People don't know about this history and I really wanted for them to wrestle with, grapple with, talk about, think about the racial and wealth inequalities in 20th-century America — and particularly the federal government's role in creating that," Robert Nelson, director of the Digital Scholarship Lab at the University of Richmond told National Public Radio in 2016 after he and a team of academics launched the interactive Mapping Inequality tool that charted how the federal government categorized black neighborhoods as too risky for federally-backed mortgages in a practice known as redlining.
That history is increasingly part of the broader public discourse, with notable contributions from authors like Ta-Nehisi Coates for the Atlantic and Richard Rothstein in his recent book, The Color of Law. "Redlining went beyond FHA-backed loans and spread to the entire mortgage industry, which was already rife with racism, excluding black people from most legitimate means of obtaining a mortgage," wrote Coates in his article, "The Case for Reparations."
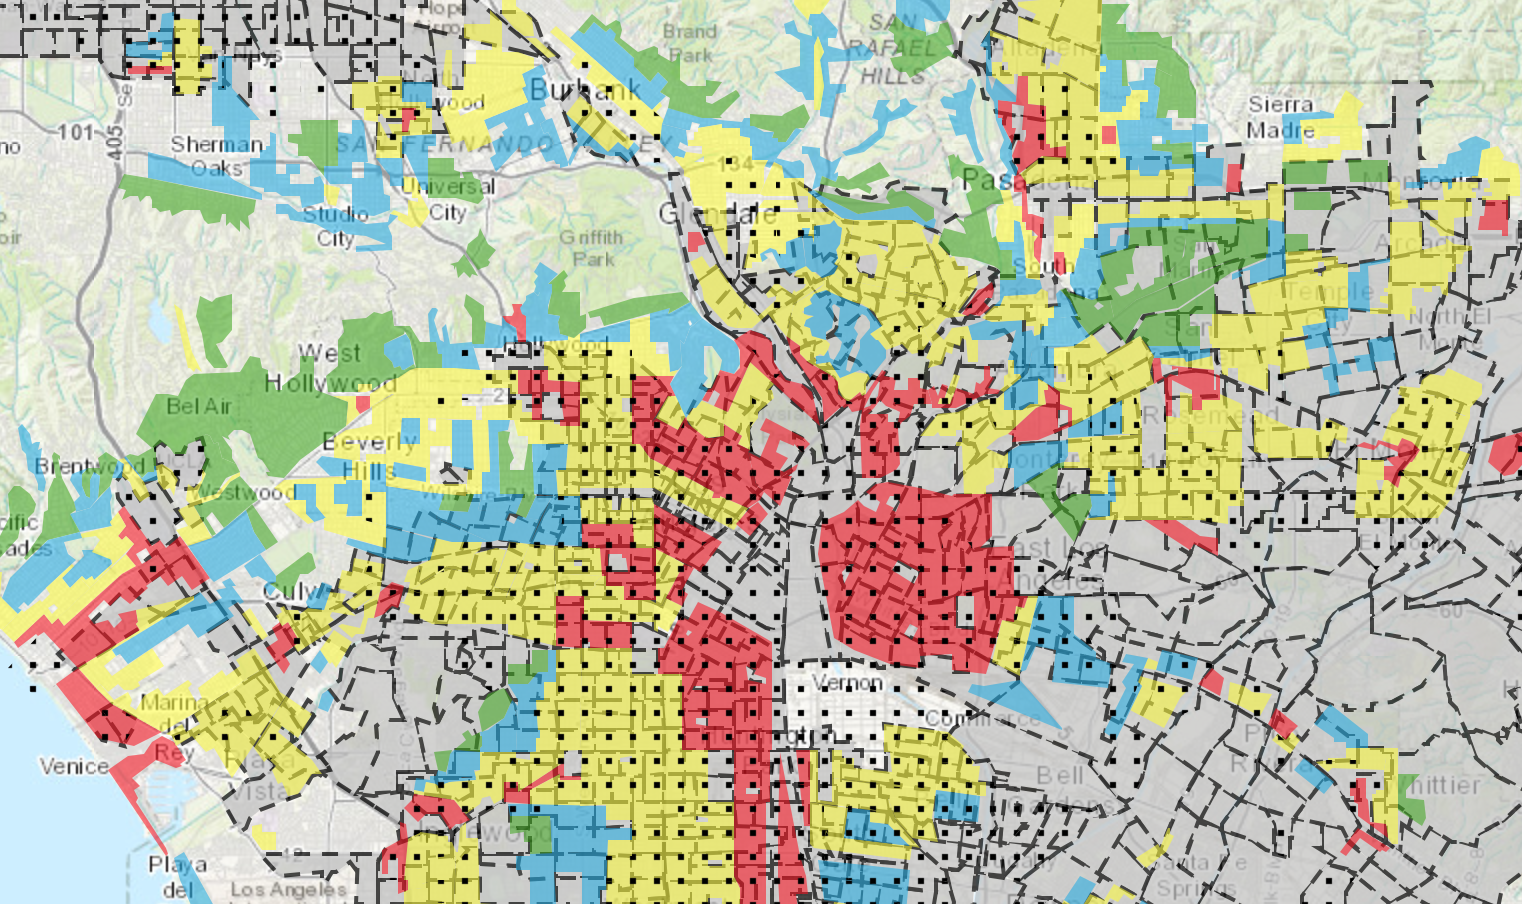
Now, a new interactive map from the National Community Reinvestment Coalition layers those old Home Owners' Loan Corporation maps that revealed which neighborhoods were redlined with current demographic and income data to illuminate the impact of redlining on today's landscape of segregation and gentrification.
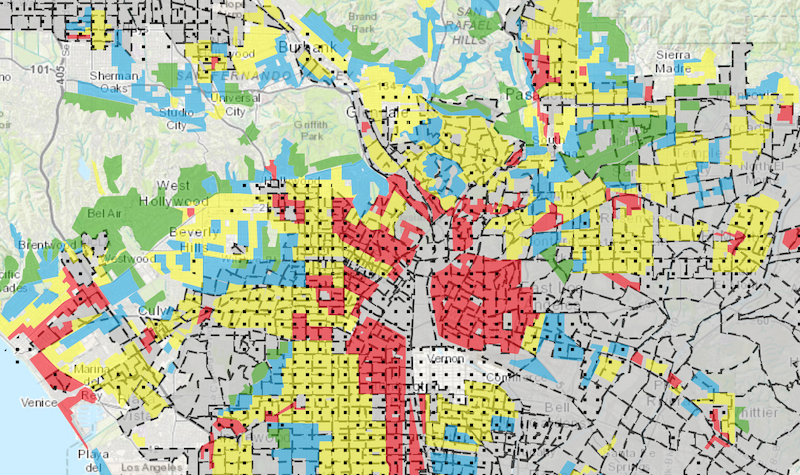
From the interactive map, the black dots indicate areas where the 2015 median family income is 80 percent or less of the area average. Areas outlined with a dashed black line indicate populations that are majority-minority as of 2010. And the green, blue, yellow and red areas indicate the grades assigned to those neighborhoods by the Home Owners' Loan Corporation in descending order with red being the worst.
When confronting today's enduringly segregated residential landscape, argues Rothstein, it's sometimes maintained that much of it is not the product of government-sponsored segregation, but of private discrimination. Through a series of case studies that break down the ways in which local, state and federal policies enforced segregation and depressed incomes of and diverted resources from black families and communities, Rothstein seeks to challenge that narrative and reframe how we understand today's segregation. "African Americans," he writes, "were unconstitutionally denied the means and the right to integration in middle-class neighborhoods."
This new mapping tool offers still more testimony about the enduring legacy of state-sponsored segregation. And, as Oscar Perry Abello points out at NextCity it reveals how new landscapes of revitalization and gentrification fit into this landscape.
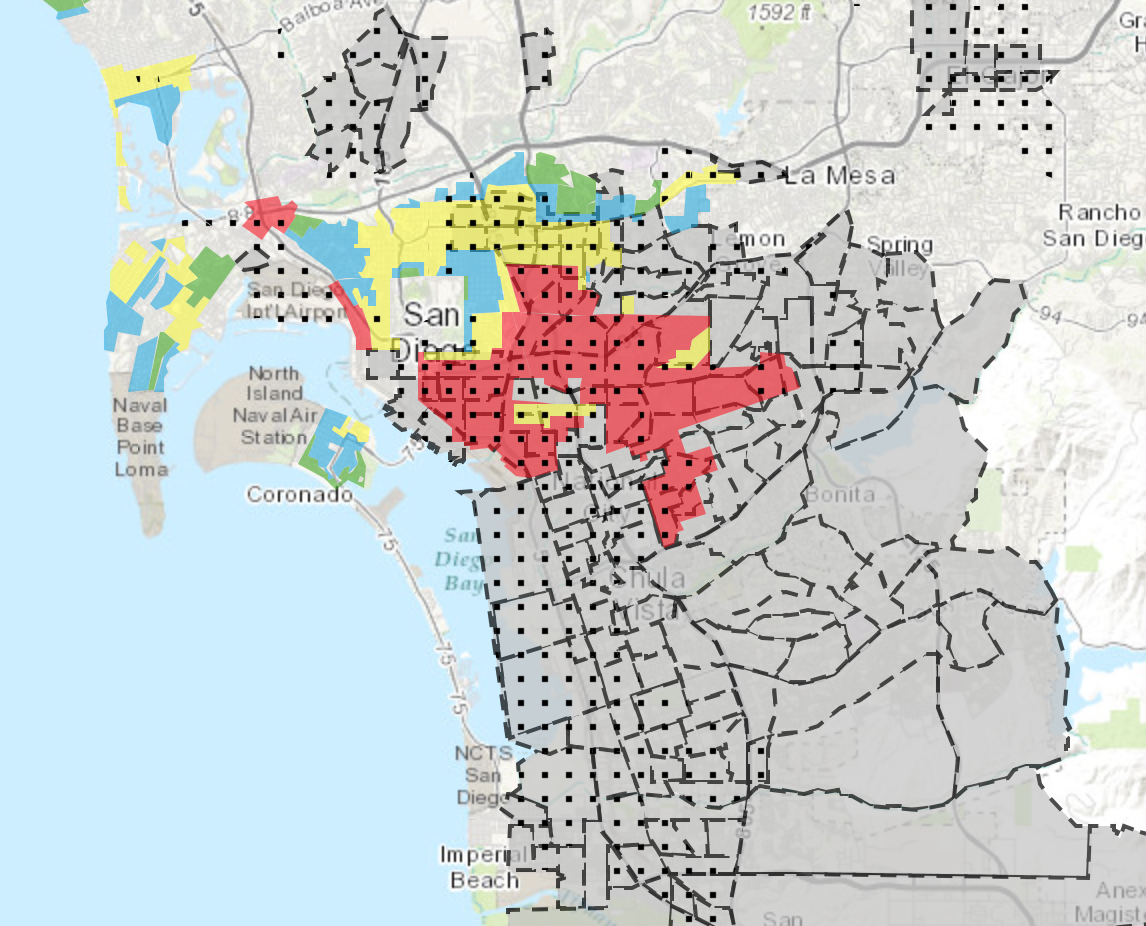
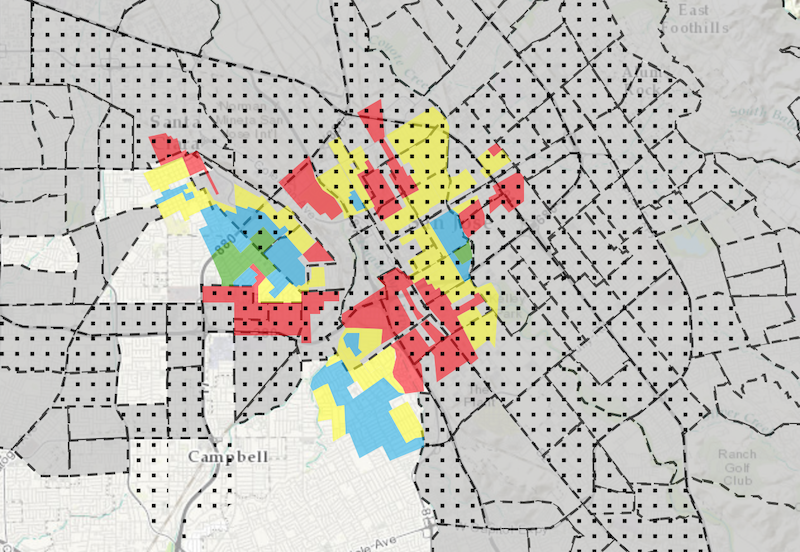
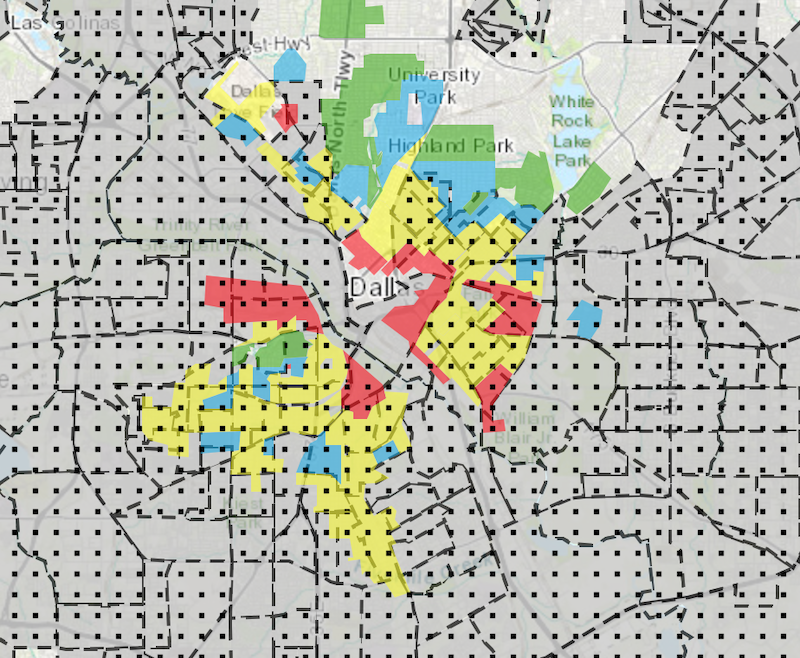
Cities like San Diego, Dallas and San Jose reveal how even cities that had their moment in the second half of the 20th century still maintained the segregation ingrained in the system created in the 1930s.
Houston is not one of the cities included in the interactive map. But it easily could. Susan Rogers of the University of Houston has written about these practices in Houston.
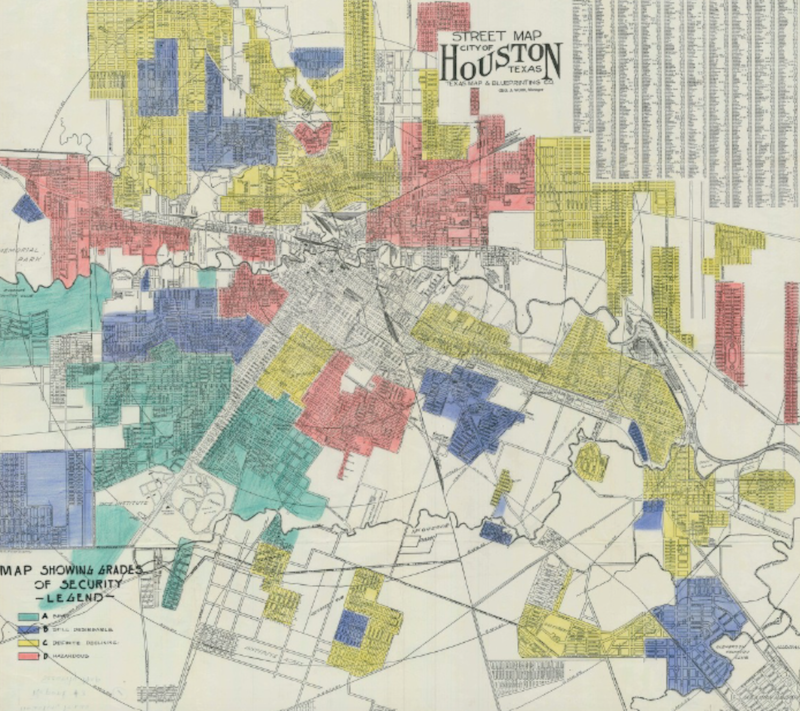
Once a "hazardous" area, according to HOLC, the now largely gentrified, historically African American Freedmen's Town Fourth Ward can be seen adjacent to the "still desirable" area next to the "best" Montrose and River Oaks neighborhoods.
As Abello writes, "pick almost any hot neighborhood today — and you are likely to find a formerly redlined area that is now being transformed." It isn't just that families barred from accessing reasonably priced mortgages were shut out of the wealth-building vehicle that is home ownership but it's that entire communities starved for resources are now being "revitalized" for the benefit of new residents because that initial undervaluing makes them attractive.

