
The historic character of a community is often obvious. You can see it in the rooftop lines of adjoined rowhouses or in the charming pocket park tucked beside a collection of apartment buildings. You can track it through the single-family residential neighborhood with small businesses on the corner. Even the culture of residents reflects the past and helps define communities.
But in some places the past is less obvious and its significance harder to protect. This is especially true in cities, where development and redevelopment routinely erase buildings, and too often, the histories attached to them. The National Trust for Historic Preservation is addressing this issue by creating a measurement that uses elements of a community’s built environment to identify areas of significance that might not be immediately obvious.
Over the past few years, members of the National Trust’s Preservation Green Lab team have developed a concept they call a community’s “Character Score.” They are now using the recently launched Atlas of ReUrbanism to map that score to the streets of 50 major cities across America.
Character Score
Character Score is determined by combining three elements of any community’s built environment: the median age of its buildings, the diversity of their ages, and its granularity—a measurement of density of building and lots. Areas with older buildings, a greater mix of old and new buildings, and smaller structures have higher Character Scores. The cities in the Atlas are broken down into 200-meter-square grids, each of which receives a score. Areas with the highest scores are often hubs of activity, usually located near the historic cores of towns, and often among the most economically productive in the city.
The Character Score helps support the Trust’s argument, with a nod toward Jane Jacobs, that the most vibrant and successful communities are those that contain a mixture of new and old buildings, a mixture of uses, and a mixture of residents. It’s not just old buildings, but the relationship between the new and the old, that helps make a neighborhood successful in the Trust’s estimation. The Character Score and Atlas of ReUrbanism allow the Trust to visualize and track how well communities meet the Jacobs-inspired mantra of Older, Smaller, Better.
At first blush the interactive Character Score maps do not seem to offer much in the way of surprises—older areas near downtowns tend to have higher scores; newer areas on the fringe have lower scores. But the Atlas mapping interface allows users to toggle between the three main elements of the score, and that level of detail allows users to make interesting observations.
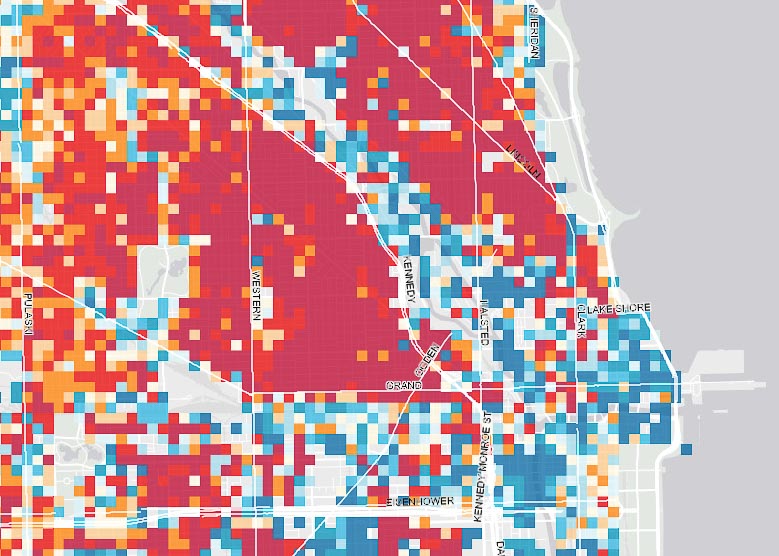
In Chicago, for instance, much of the area inside the Loop has a low Character Score, evidence of the redevelopment that has occurred there. (The famous section of the Miracle Mile, where historic structures and new development sit side by side and tower over Millennium Park, offers a notable exception to the Loop’s score.) On the north side of downtown, the predominately residential areas maintain a high Character Score, with the exception of grids alongside the Chicago River, where more recent development has occurred.

The Character Score of Chicago’s Downtown Loop. Map from the Atlas of ReUrbanism
In Philadelphia Character Scores illustrate that older, non-central residential communities have become surrounded by newer, often lower-density development. Roxborough, to the northwest of downtown, possesses a high Character Score, as much of its historic built environment persists. But the surrounding areas have lower Character Scores, suggesting a very different development pattern.
Character Scores in Houston
The Trust knows that the Character Score is just one of many measurements that can be used to understand the value and history of a given space, which is why Preservation Green Lab staff are adding a slew of socio-demographic measures to the Atlas database. Users can then begin to draw connections between Character Scores and indicators such as economic activity, race, and income.
These tools create an opportunity for partnerships between the Trust and local research entities that can benefit both parties. For local research partners, the Character Score and Atlas add an important new variable for ongoing research. For the Trust, ties to local groups with deep, on-the-ground knowledge of each city can help refine the tools and help put Trust’s information to work on the ground.
Working together, the Preservation Green Lab and the Kinder Institute mapped the change in Character Score over time in Houston. We also coupled the shifting Character Scores with our own data on demolition and construction trends from our Houston in Flux report.
Houston’s quick pace of redevelopment has led to significant changes in the Character Score in some neighborhoods. In older communities with building stock of a consistent age, the addition of new buildings actually led to an initial increase in scores. However, as development continued and newer structures overwhelmed the old, the scores dropped. Tracking such shifts over time highlighted a tipping point in many communities. Kinder Institute researchers were then able to overlay existing demolition and construction data as another method of visualization.
The southern part of the Heights neighborhood in Houston captured the tipping well. While the area maintains a high Character Score overall, the section closest to I-10 experienced a dip between 2007 and 2015. The areas that have lost the most Character Score have reached the tipping point where newer structures outnumber the historic structures.
The change in Character Score in the southern portion of the Heights. Blue colors represent a loss of Character Score, while reds show a gain. The darker the color, the greater the change. Overlaid on top of the change over time are the records of demolition (outlined in gray) and new construction (shaded gray) from the area. Map by Kelsey Walker, Kinder Institute for Urban Research.
This information can help Houston and other cities identify spaces that are going through such transitions. Layering the Character Score, data sets like the one from Houston in Flux, and other data—such as income or rates of displacement—allows cities to gain a more nuanced understanding of the changing fabric of their communities as well as what steps could be taken to better manage the transitions and help communities prepare for their outcomes.
At the moment only five cities are completely mapped—Chicago, New York, Philadelphia, Los Angeles and Houston. The remaining 45 are slated to come online in the coming months, beginning with midsize city and legacy city groupings in January. Each map is accompanied by a fact sheet that discusses the types of economic activity occurring within high–Character Score neighborhoods, supporting the case for their preservation and reuse. That information can assist city officials, residents, and preservationists in efforts to preserve different parts of the city. The Character Score helps make the case that preservation is an important part of an overall effort to create a sustainable approach to city building.
Kyle Shelton is the Director of Strategic Partnerships for the Kinder Institute of Urban Research at Rice University. Shelton received his PhD in American Urban History from the University of Texas at Austin. He researches the intersection of transportation, politics, and development in American cities.
This piece was cross-posted at the National Trust for Historic Preservation's blog, The Forum.