
Houston and Harris County have well-deserved reputations for built environments that are spread out and low density. The region’s sprawling suburban, single-family subdivisions support this image and numbers bear this out --single-family detached homes make up 61 percent of all housing stock in the county.
However, digging deeper into the county’s residential building stock complicates the notion that its built environment should be defined solely by its low-density housing.
The Kinder Institute’s latest report Taking Stock analyzes the county’s residential building stock based on age, type, and density. One thing that jumps out from the findings is the diverse range of housing densities found throughout Harris County.
Dense, compact areas in Houston complicate the easy conception of the region as the capital of sprawl. Further, at a time when the city is experiencing a boom of residents moving back into the core, existing dense communities offer many lessons about the future of our region’s development.
While the county’s most dense communities are dominated by large multi-family properties of more than five units (which makes up 37 percent of housing stock overall), Taking Stock shows that this in not the only form Houston’s density takes. Some neighborhoods have much higher densities than the county as a whole, and within these communities, there are a mix of housing types.
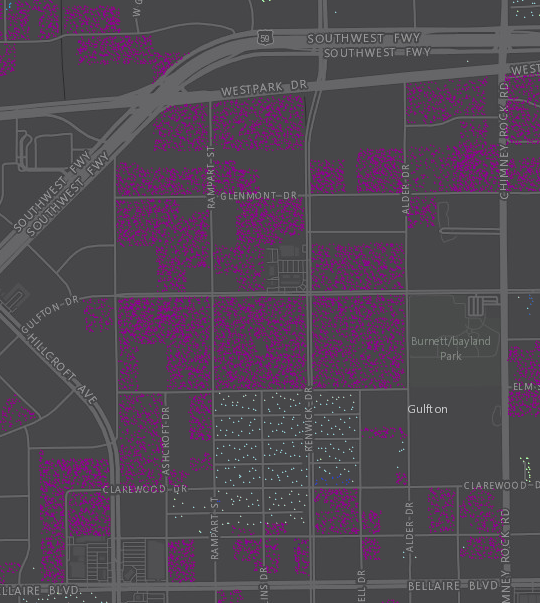
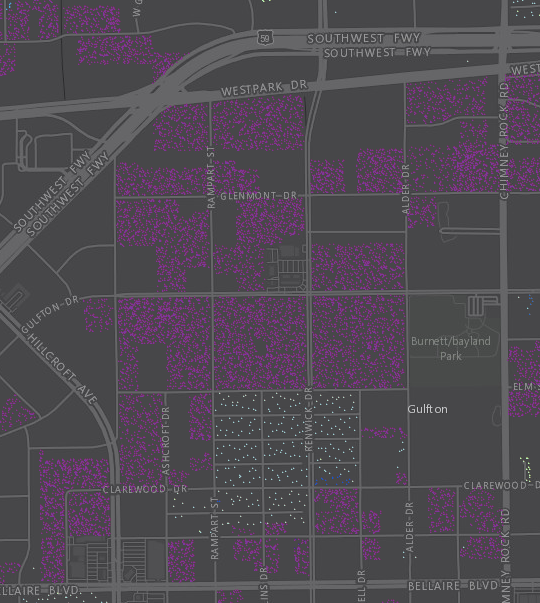
The county’s five densest areas are Gulfton, Westwood, Mid-West, Pecan Park, and Montrose. These are all quite different areas both in terms of socio-demographics, location, and residential building stock.
Gulfton (14,600 people per square mile) and Westwood (12,400 people per square mile), to the southwest of downtown, are by far the densest, with levels of density exceeding that of Chicago. In those areas, the residential building stock is more than 90 percent large multi-family properties. The concentration of heavy apartments here is the landscape most Houstonians would think of when asked about the densest parts of the county.
When we look at the next tier of dense communities—Mid-West, Pecan Park, and Montrose—the realities of what density looks like begins to change. All three communities have around 10,000 people per square mile, comparable to the overall density of Newark, New Jersey. What Taking Stock makes clear, though, is that each of these communities achieves this density in a unique way.
Mid-West, located west of the Galleria area, is another community in the Gulfton mold with 87 percent of its housing being large, multi-family properties. Montrose is 55 percent large multi-family, and only 32 percent single-family detached homes. Eleven percent of its housing is smaller, two- to four-unit multi-family properties. Pecan Park, on the city’s east side, is 55 percent single-family detached. Despite these different breakdowns each community holds about the same density.
The communities, of course, have different residents and face different challenges and opportunities. Residential housing stock only tells a part of their stories. But that part is foundational to understanding how these communities are connected to the issues confronting the larger region.
The housing stock in Gulfton and Westwood is aging, and many of the large multi-family units are notoriously under-maintained, raising questions about quality of housing for existing residents. Montrose and Pecan Park are both feeling redevelopment pressures, and the smaller multi-family units that are often more affordable are disappearing. Each of these patterns are visible in the data Taking Stock presents.
The striking findings about density are just one aspect of Taking Stock. By comparing the current residential stock to that which existed in 2007, the report also identifies a number of patterns in the way the county’s housing stock is growing and changing. Both single-family attached units (townhomes) and large multi-family properties, for example, have outpaced the growth rate for single-family detached homes over the past decade.
The age breakdown also captures the county’s various cycles of development. With construction going outward away from the city through the mid-2000s, and then experiencing an emerging reversal to the central areas of the city in the latest cycle.
All of these trends can be explored in more depth through an interactive map found at www.takingstockhouston.com.