

Houston is getting older. Fast.
That’s one of the takeaways from Thursday’s annual release of updated estimates by the U.S. Census Bureau via the American Community Survey — the Census’ rolling 5-year estimate of demographic trends.[1]
Here’s the bottom line: Since 2010, metropolitan Houston has added about 1 million people to its population. That’s not unusual — it happens in virtually every decade. But here’s the unusual part: More than 400,000 of them were over the age of 55. Even though only about 20% of the region’s total population is over that age.
In percentage terms, the population of those over 55 is growing at a much faster rate than the younger population. And even in absolute terms, they are coming close to being a majority of the population growth, even though their overall numbers are much lower.
To get even nerdier about this, take a look at Figure 1, which breaks down the percentage increase of the population in the Houston metro area by age during the time period we’re talking about. The number of people ages 65 to 84 grew by half during this period. By contrast, the number of people under the age of 20 grew by only about 10%.
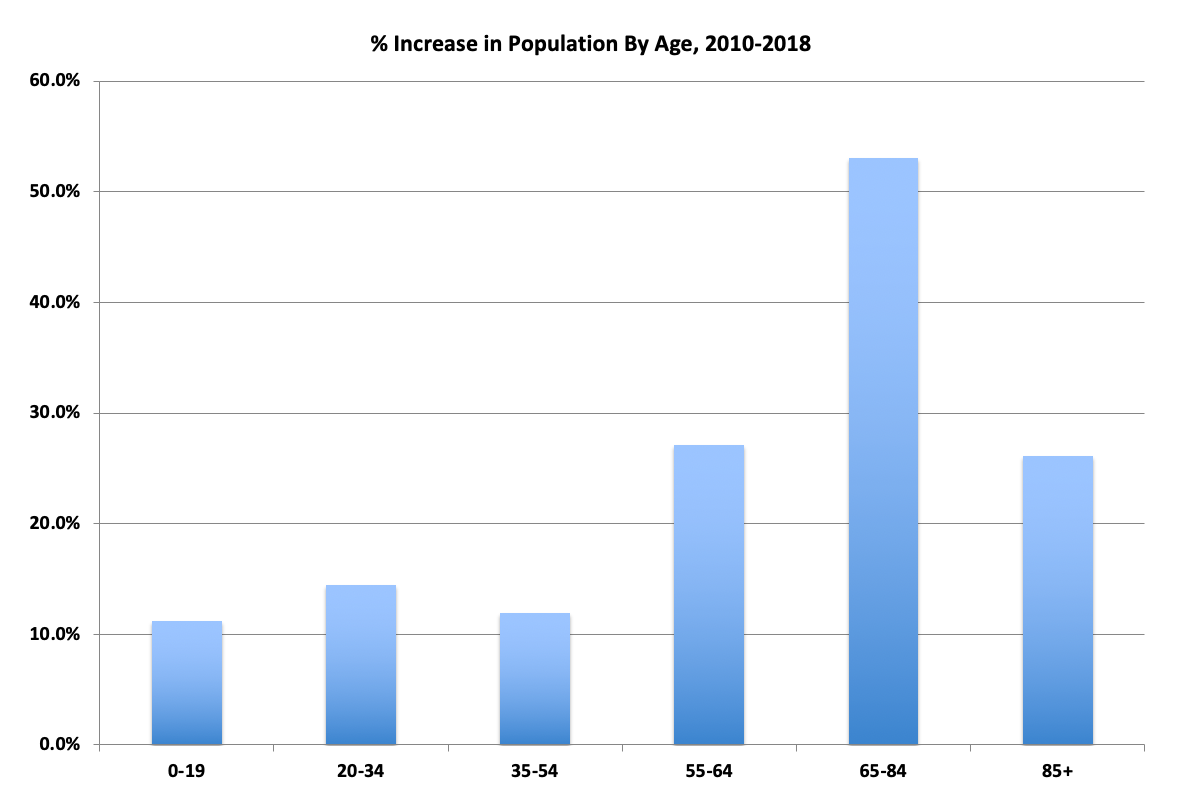
Data from the American Community Survey
This doesn’t mean that there are literally more older people moving to Houston than younger people. Population growth doesn’t come just from in-migrants from other states — the traditional source of growth for Houston. It also encompasses immigration from other countries and natural increase (the number of births minus the number of deaths).
So, the startling age numbers mostly mean that people who already live here are living longer and not moving away. But it also probably means that younger people are not moving here — from other states or other countries — in the same numbers they were a few years ago. Previous Census numbers have revealed that, since oil prices dropped in 2015, Houston’s overall population growth has slowed — so much so that we are now significantly behind Dallas-Forth Worth in overall growth.
It may also be that as immigrants from other countries acculturate to the U.S., their fertility rate is declining — which is a pretty common occurrence.
But don’t fret that there are no young people in metropolitan Houston. Indeed, there are still far more young people than old. For example, as Figure 2 shows, there are about 2 million people under the age of 20, and only about 800,000 between the ages of 65 and 84. And the population of all groups is growing.
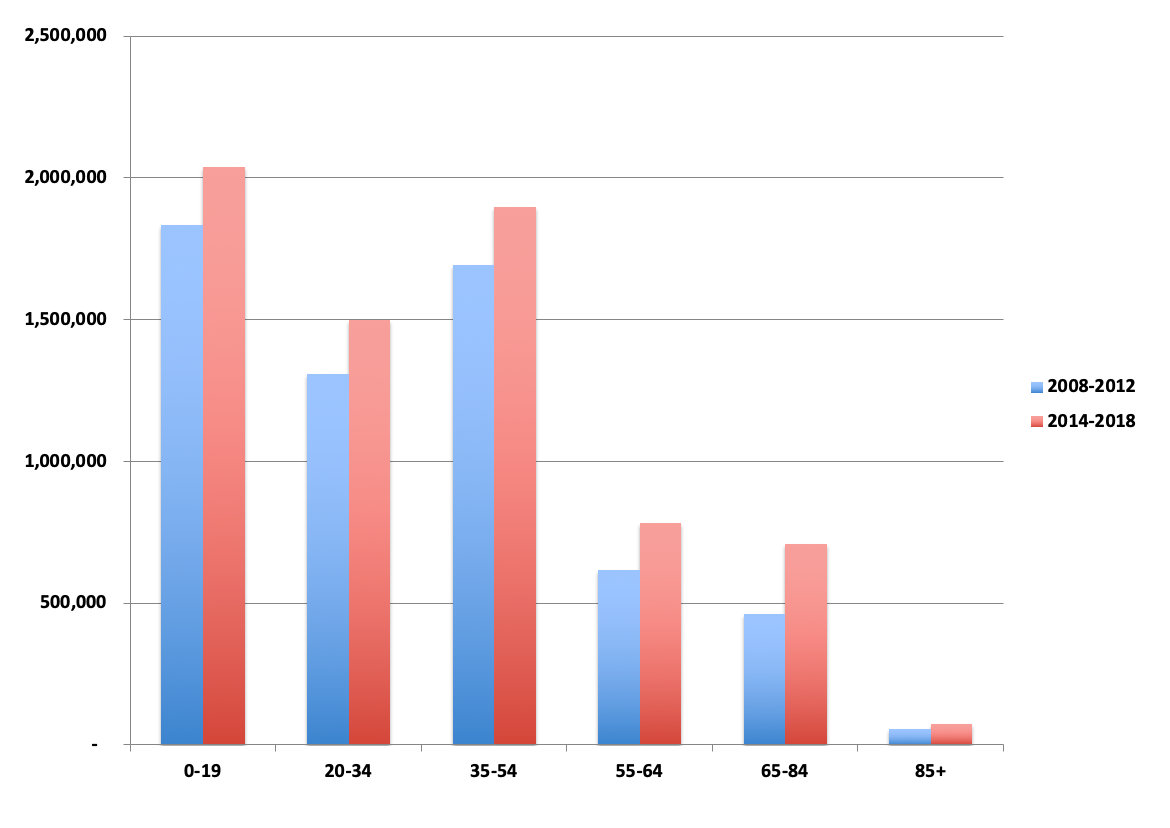
Data from the American Community Survey
But note the trend in that chart: The number of older people is growing much faster, relative to the size of their population, than the number of younger people.
In the short term, this is fine. But in the long term it’s worth watching. One reason is an older population puts a lot of pressure on the health care system. Also, older people are not retiring at as young of an age as they used to. (The author of this blog is a good example.) And as the ratio of old to young shifts, other distortions occur. The number of potential caregivers shrinks. As does the number of people available to buy an older person’s house.
This trend is not unique to Houston. Indeed, the Census Bureau’s press releases about this year’s ACS focused almost entirely on trends among older people. But for a region so accustomed to a steady influx of ambitious young people looking to make it, the current pattern is something that should cause concern.
[1] The data released Thursday was the five-year rolling average of the American Community Survey from 2014 to 2018. In this piece, we compare those numbers to the ACS five-year rolling average from 2008 to 2012.