
The concerns of renters have garnered journalistic and policy attention. Our local news seems to regularly include stories about the challenges of making rent or dealing with negligent rental property management. Tenants face increasing rents, but less is known about local property managers and landlords, or how households are stressed by the increase in rents, or the building quality of local rentals.
This year’s State of Housing report moves toward answering these questions and found evidence of troubling vulnerabilities in terms of cost burdens, evictions, building quality and the role of large institutional investors.
What do we know? Who are renters?
Homeowners in Harris County and Houston are disproportionately white, meaning that policies and programs that benefit existing homeowners disproportionately benefit white people. White non-Hispanic people are 28% of the county’s population, but represent 42% of owner-occupied households — that is, the head of household is a White non-Hispanic person. Meanwhile, when the head of the household is a Black person, two-thirds of those households are renters.
Conversely, policies that benefit renters would disproportionately benefit households with more moderate incomes. In Harris County, the renter median household income is about $45,000, less than half of the owner household median of $92,087. This year’s State of Housing report includes much more data comparing renter and owner incomes, education and building types.
Despite the importance of understanding rentals, researchers lack data on what renting truly costs. No single organization keeps track of lease terms, as leases are individual contracts between landlords and tenants. We don’t know the true inventory or location of every rental unit; we can only make estimates through other sources. The American Community Survey (ACS), which includes self-reported rent cost data, is the best that we have for rents, despite having margins of error that come with any survey, particularly at the neighborhood level.
The Kinder Institute coupled an in-depth analysis of ACS data with Harris Central Appraisal District (HCAD) and other data sources to get a more fleshed-out picture of rentals and renting in Harris County.
Evictions and affordability
Colleagues at January Advisors have shown how local eviction filings have increased dramatically since post-COVID-19 rental protections expired. This year’s report also contains details on which neighborhoods have seen the sharpest increases in eviction filings, along with the most total eviction filings. The places where eviction filings increased the most, in terms of percentage, are very different than those with a high number of evictions. The high-percentage neighborhoods have fewer residents, fewer rental structures and higher incomes compared to the lower-income/high renter areas that have a larger number of total evictions. While the neighborhood with the highest total number of eviction filings in 2022 was Eldridge/West Oaks (2,910), the neighborhood with the highest percentage increase from 2020 to 2022 was Washington/Memorial Park (206 filings, compared to only 28 in 2020).
Alongside increasing evictions are increasing rents. Between 2015 and 2021, median gross rent on a two-bedroom rental increased 29% in the city and 30% in Harris County (to $1,186 and $1,181, respectively). Wages, meanwhile, increased by about 23%. The neighborhood with the highest percentage rent increase was Second Ward, almost doubling from $608 to $1,213.
This year’s State of Housing report elucidates how high rents mean stretched budgets: 51% of county rental households are cost-burdened, meaning that they are paying more than 30% of their monthly income on rent.
The 30% definition, which is a standard measure in this country, doesn’t take into account rising prices on non-housing costs, like food or transportation. Nor does it account for how different family sizes and income levels can mean that households have a tougher time meeting needs because of more mouths to feed.
Using public-use microdata and adapting an approach from researchers at the Harvard Joint Center for Housing Studies, Kinder Institute researchers built a more comprehensive measurement of cost burden. This measurement takes into account the rising costs of food, transportation, child care and other non-housing essential costs.
We concluded that 60% of households are cost-burdened when accounting for these other costs, larger than the 51% share when using the other measure. Renting families are particularly stressed: While only 55% of Harris County’s single-person rental households are estimated to be rent-burdened, 73% of two-parent households with children and 88% of single-parent households are rent-burdened. The report contains more detail on our methodology, and other crucial dimensions of local cost burden.
Corporate single-family landlords in Harris County
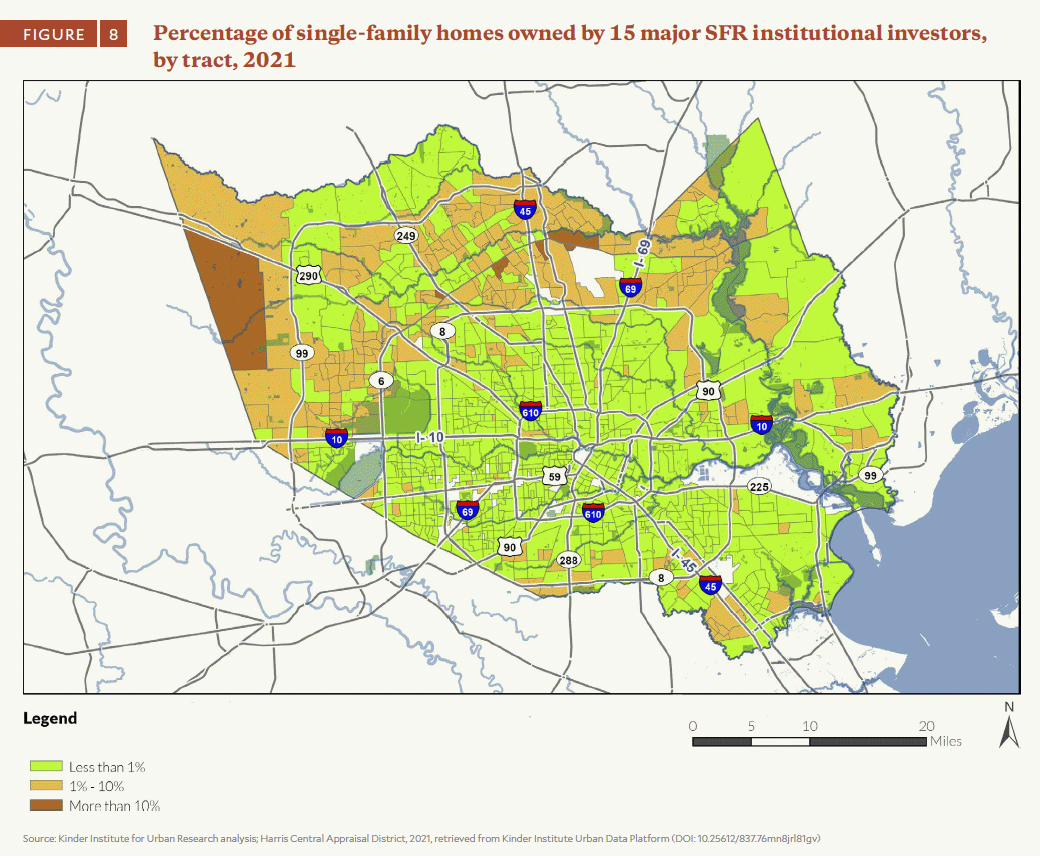
This year’s report also maps the footprint of a select group of large, national-level single-family rental (SFR) institutional investors. Some of these 15 companies, which include Invitation Homes, Progress Residential and American Homes 4 Rent, have a large footprint in Harris County, with all 15 combining to own an estimated 10,385 single-family homes.
Kinder Institute researchers were able to identify these companies’ holdings based on ongoing work done by members of the State of Housing team alongside researchers at other universities,1 linking owner names in HCAD data to a small set of national-level SFR institutional investors.
This year’s research shows that when there is a larger share of rental homes owned by these companies, there is a statistically significant increase in a neighborhood’s eviction filing rate. An important qualifier is that this finding is only for the neighborhood level and does not mean that any of the 15 highlighted national SFR institutional investors are filing these evictions. But this finding supports the conclusion that these companies invest in neighborhoods where renting is precarious. Future research can examine eviction data at the parcel level to determine what type of landlord is doing the evicting.
While at the county level the extent of these investors’ holdings is small — only 4% of all single-family rentals — in certain neighborhoods in northern Harris County they have around 25% of the total single-family building stock, which emphasizes the importance of understanding these companies’ eviction filing tendencies in future research.
We also examined SFR property owners beyond these 15 companies, looking to understand the broader landscape of the county. We identified an estimated 12,240 LLCs or other entities that each own only one single-family home in Harris County, which would suggest a proliferation of “mom and pop” landlords. This footprint is only slightly more than the estimated 10,385 homes owned by only 15 national-level companies. These numbers raise questions about corporate consolidation of the single-family rental sector in Harris County. Further work is needed to identify whether these smaller-scale LLCs are owned by larger holding companies and to determine the extent of their holdings.
How livable is your rental?
In this year’s report, we go deeper into two measures of rental housing quality: building age and building quality.
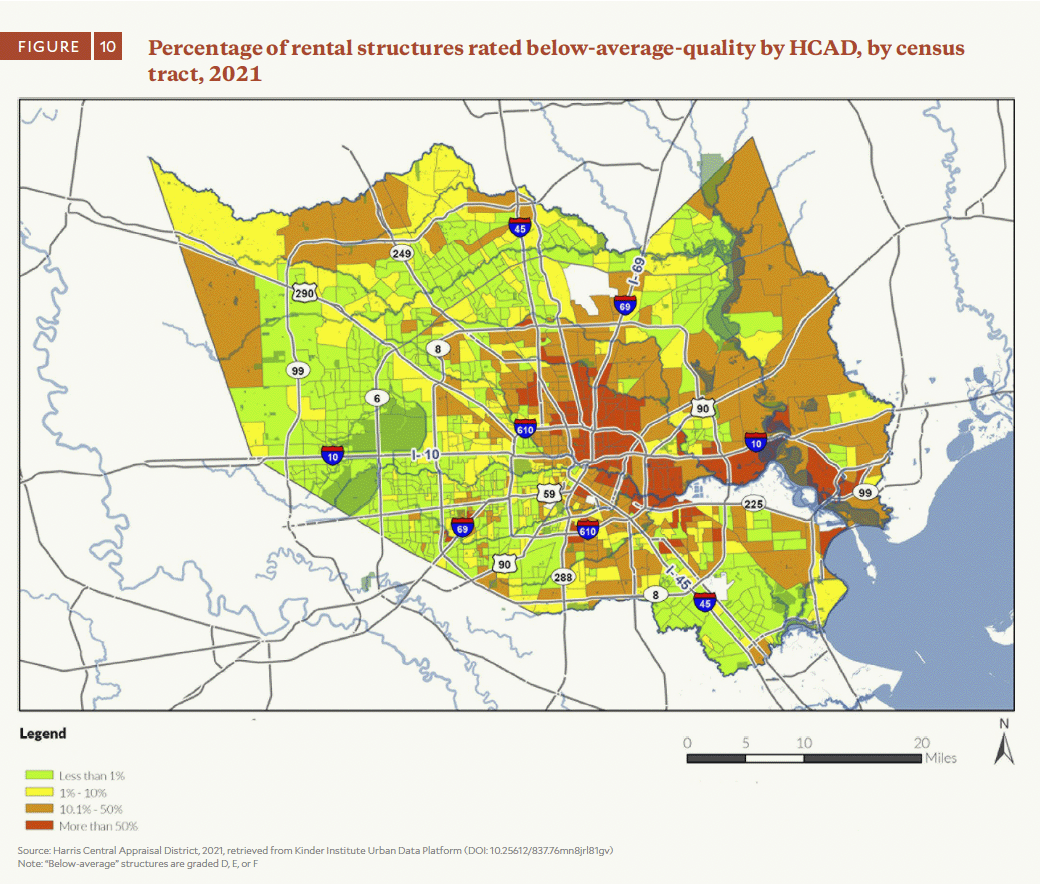
As part of the property assessment process, HCAD assessors assign buildings a grade similar to A-F grades in school. About two-thirds of rental structures have a C grade, which is average per HCAD ratings, while 18% of structures (60,220) have a D, E or F, falling below average. Many rental properties with these grades are north and east of downtown.
The second measure of building quality is effective year built, which takes into account major renovations.
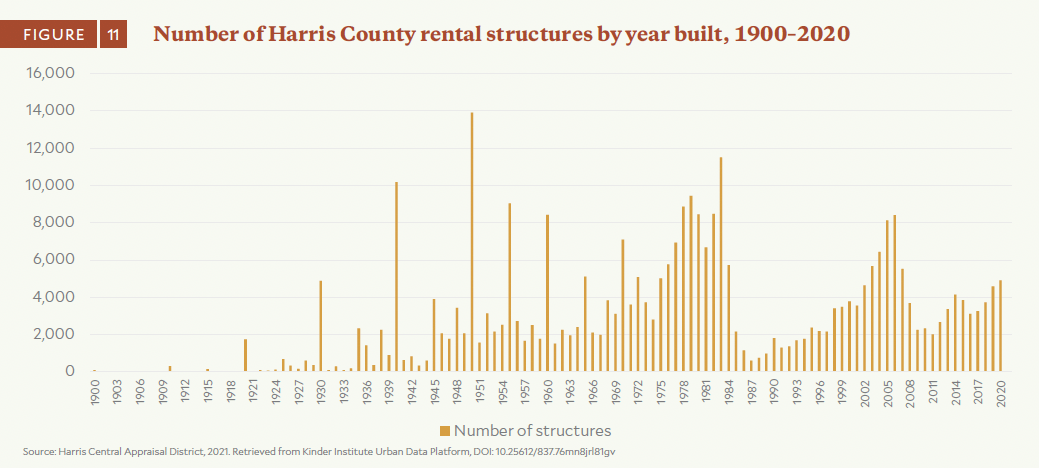
About 29% of the county’s rental structures were built between 1970 and 1985, when the 1973 and 1979 oil shocks led to a strong domestic oil sector that helped Houston’s economy, and post-1980 savings and loan deregulation allowed easier investments in multifamily housing construction. Since 1960,2 the years with the most properties built were 1983 (11,492 structures), 1979 (9,440) and 1978 (8,861).
There were also peaks in construction since then. The pre-Great Recession building boom saw much residential construction: 2006 was the year the most current rental structures (8,404) were built in this century, with the number dipping under 3,000 by 2009. Recent years have seen an upward trend, as 2018 through 2020 saw more rental structures built every year.
This year’s report finds that Harris County neighborhoods with a concentration of older rental structures and more below-average quality rental structures tend to have fewer residents, lower rent and lower household incomes. This suggests that those facing the most concerns with their rental structures have fewer means to address the issue and are driven toward lower-quality buildings because of the low rent.
Conclusion
This year’s report raises as many questions as it answers. These questions concern the relationship between landlord type and evictions, how the growth of single-family rentals affects the owner-occupied home sales market and how families’ budgets change when their rent is high, and invites further questions into measuring housing quality.
Two main themes emerge.
First, issues that affect renters don’t affect all of Harris County evenly. Justice for renters is racial justice, and justice for renters is justice for working-class Houstonians and Harris County residents. Meanwhile, policies that support homeownership, like the mortgage interest deduction, fall onto an already privileged stratum of society. To ensure that those ownership benefits reach a diverse population, renters need the household stability that comes with having a safe dwelling and the ability to save for a down payment.
Secondly, the challenges facing renters — like affordability, building quality, or evictions — aren’t just about renting. They are connected to other policy arenas. Rent is a fixed monthly payment for which the penalty for non-payment is homelessness. To meet high rents, households must skimp on necessary expenses like food and child care. Older buildings are more likely to have toxic lead paint, leading to negative health outcomes. There are more connections between housing, health, education and economic mobility to elucidate and research, with the aim toward generating actionable solutions. As the Kinder Institute grows and diversifies its research focuses, we intend for our future housing work to connect to these other topics.
[1] The first paper from this project, led by Dr. Eric Seymour at Rutgers University, is currently under review after a revise and resubmit at Journal of Urban Affairs. A version of this work was presented at the Association of American Geographers conference.
[2] For 1990 and prior, there are noticeable “peaks” in the counts of structures at the first years of the decade (e.g., 1950, 1940, 1930). We hypothesize that this reflects HCAD making an estimate that the building was built during the decade, and they lack the exact year-built data.